IELTS Writing Task 1 – Step by Step Guide (Pie Charts)

This lesson takes you step by step through an IELTS Writing Task 1 sample answer. Learn in easy steps how to describe IELTS Pie Charts for writing task 1. Below are easy techniques to help you write each paragraph: introduction, overview, body paragraph 1 and body paragraph 2.

How to Tackle IELTS Writing Task 1

This lesson focuses on two pie charts. As you see, below, pie charts can have a lot of categories. Most people think the best way is to organise information by describing one pie chart at a time. However, this is not usually the most effective way to tackle them if you are aiming for band score 7 and above.

IELTS Pie Charts – Example Task

IELTS pie chart lesson

Source: The above pie charts were not created by IELTS Liz.

Describing Pie Charts Step by Step

Below you will find easy to follow advice on how to describe your IELTS pie chart paragraph by paragraph.

Introduction

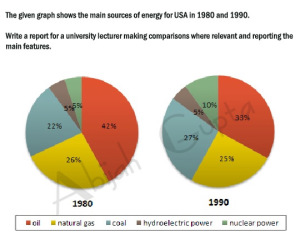
You must paraphrase the information given at the top of the charts “The graph shows the main sources of energy for the USA in 1980 and 1990”. You cannot copy this, you must use your own language and then add any extra information needed from the charts.

Tips

  • the graph = the pie chart
  • shows = illustrates
  • main sources of energy = energy production from different sources
  • for the USA = don’t change this
  • in 1980 and 1990 = in two different years (1980 and 1990)

Try writing your introduction before checking the model answer. To see model introduction, click here: Model Answer

The pie charts illustrate the changes in energy production from five different sources (oil, natural gas, coal, hydroelectric power and nuclear power) for the USA in two years (1980 and 1990).

Overview

The overview contains the key features of the charts. Answer the questions below to find the key features.

  1. What was the main source of energy in 1980?
  2. What was the main source of energy in 1990?
  3. Which produced the least energy in 1980?
  4. Which produced the least energy in 1990?
  5. Did the amount of energy produced by each source change a lot or just a little between the years?
  6. Did all types of energy increase by 1990?

Now write your overview before you check the model. To see model overview, click here: Model Answer

Overall, oil  constituted the main source of energy production in both years, while hydroelectric power  produced the least energy. There was a slight decrease in production from oil and natural gas, whereas an increase can be seen in the figures for coal and nuclear power.

Body Paragraph 1

This paragraph will give details about oil and hydroelectric power, which we highlighted in the overview above.

Tips

  • You will need to write one sentence about oil comparing the percentage each year and then one sentence about hydroelectric power comparing the years.
  • You must add data (percentages and dates) to support each sentence

Here are two example sentences. Fill in the gaps with the right words.

The amount of energy produced by oil in the USA 1. ………………. 42% in 1980 and this, then, 2. ………………….. to a third (33%) in 1990. The proportion of energy from hydroelectric power, 3………………, remained constant in both years ………a mere 5%.

For answers, click here: Answers

  1. accounted for / comprised of / made up / was
  2. fell / declined / dropped / went down / decreased
  3. on the other hand / by contrast / in contrast ( we use a linker to highlight that this is opposing information to the previous sentence)
  4. at

Body Paragraph 2

This paragraph will give detail about the other sources of energy in the pie charts.

Tips

  • which sources increased?
  • which sources decreased?
  • what were the percentages for each source?

Again, fill in the gaps in these model sentences.

The energy generated by natural gas, which was the second 1. …………… source of energy in the USA in 1980, fell 2. ………. 1% to a quarter of all energy produced in 1990. In contrast, production by coal 3. ……………… from 22% to 27% in 1990 4. …………….. there was a 5% rise in energy from nuclear power to reach 10% in the second year.

For answers, click here: Answers

  1.  largest / major
  2. by (this is used when writing about differences in amounts)
  3. increased / rose / went up / climbed / grew
  4. while / whereas

Recommended Lessons

FREE SUBSCRIBE

Subscribe to get new lessons & tips by email.

.

Improving IELTS Writing Task 1 Introduction

This lesson focuses on improving your IELTS writing task 1 introduction for the academic paper. To write an introduction you must paraphrase and re-write the information given by IELTS about the chart of graph.

Below is a sample line graph sent to me by an IELTS Candidate.

The line graph below shows the number of overseas students who came from six Asian countries to study in Australia from 1994 to 1997.

overseas students line graph ielts

Source: Graph above was not created by IELTS Liz.

Introduction Paragraphs for Writing Task 1

Below are two introductions written by the IELTS candidate. Would you use one of these introductions or would you write a different introduction?

Introduction 1: The diagram shows the amount of students from six different countries in Asia, who came to study in Australia between 1994 and 1997.

Introduction 2: Between 1994 and 1997 the number of Asian students from six different countries, who came to study in Australia.

Questions:

  1. Do they cover all the necessary information?
  2. Are there any errors in them?
  3. How you would write your introduction to the line graph above?
  4. How many paragraphs would you have for your complete report for the above line graph?

Feel free to post your answers. However, please note I do not common on writing.

Answers and Model Introduction  

Click below to reveal the answers and model introduction paragraph. 

Answers & Model Introduction
  1. They both cover most of the important information. However, they are lacking the list of countries. Where possible include the list, unless it is too long. 
  2. Errors:
    1. A line graph is a line graph. Those words should not be paraphrased.
    2. Always try to paraphrase the verb “shows”.
    3. The word “amount” is for uncountable nouns, not for countable nouns. We can use this word with “people” or “students”. See this page: Uncountable Nouns
  3. See the model answer below:
    1. The line graph illustrates how many students from six different countries in Asia (Japan, Singapore, Hong Kong, Malaysia, Indonesia and Korea) went to Australia to study in 1994, 1995, 1996 and1997.
  4. How would you organise your task 1 writing for the above line graph? How many paragraphs would you have? What information would you put in the body paragraphs?
    1. You should have 4 paragraphs: introduction, overview, body paragraph A and body paragraph B.

      In body paragraph A, you can put information about Singapore, Malaysia, Indonesia and Korea. In body paragraph B, you can put information about Japan and Hong Kong because they showed different trends from the others.

.

IELTS Writing Task 1 Free Lessons & Tips

Click below to open all my free lessons and tips for task 1:

IELTS Writing Task 1 Free Lessons

………………..

Subscribe for Free to get New Lessons by Email

IELTS Diagram: Rainwater

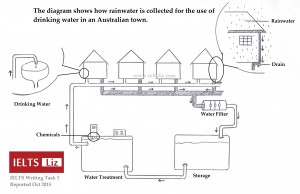
This IELTS diagram appeared a number of time in Writing Task 1 (academic). It is typical of many diagrams that are used by IELTS. There is also a model diagram answer given below. The model answer is estimated at band score 9. Note that diagrams are also known as processes.

Note that as in all Writing Task 1 (academic paper), you must have an overview. Pay attention to the summary of key stages in the process in that statement.

IELTS Rainwater Diagram

Reported Diagram from IELTS candidates. This diagram has appeared over a number of years, most recently in 2024.

IELTS Rainwater Diagram

IELTS Diagram Model Answer

The diagram illustrates how an Australian town processes rainwater to use as drinking water.

Overall, rainwater is collected from houses and then passes through a filter into storage where it is then treated with chemicals to make it fit for human consumption.

Initially, the rain which falls on the rooftop is collected by the gutter and then runs down the pipe at the side of the house into the drain at the bottom. Each house collects rainwater in this way and the rainwater is then passed along underground drains to the water filter.

The rainwater passes through the water filter to remove any impurities. Once it has been filtered, it continues along the pipes to a storage tank. From this point, the water goes from storage to the water treatment. At this stage of the process, the water is treated with chemicals in order to make it fit for consumption. When the water is ready for drinking, it travels along pipes that lead back into the houses in the town where people can use the water for daily consumption.

179 words

Other IELTS Writing Task 1 Model Answers

FREE SUBSCRIBE

Subscribe to get new lessons & tips by email for free.

.

Which preposition?

Using Prepositions in Writing Task 1

Choose the right preposition to complete the sentences below:

  • for
  • of
  • to
  • as
  • by
  • down
  • in
  • over
  • no word

Sentence Completion

  1. The number of sales rose …….. 5,000 from 20,000 to 25,000.
  2. The percentage of boys playing sport was 45% as opposed ……… girls at 30%.
  3. While, the sales fell ……… to 150 in 1990, they rose again to 300 by 2010.
  4. The sales in December accounted …… about 50% of the total annual sales.
  5. There was a downward trend in the number of people visiting online stores ….. a period of three months.

Answers

The answers are now available for this lesson.

For answers, click here: Answers to this lesson

All the best

Liz

Get my free lessons by email

Subscribe for free to get my new IELTS lessons sent to your email inbox.

IELTS Complex Table for Writing Task 1

A model answer for an IELTS complex table for writing task 1.  The table below has been reported in the IELTS test a number of times so it is definitely worth reviewing and learning from. IELTS do like to recycle writing task 1 charts, tables etc which is why you need to review tasks from previous years. It is not common to be given a table with so many categories and numbers, but when you get it, you must be prepared to group information together in a logical way rather than ignore categories completely. This model answer will help you understand how to organise the information.

IELTS Complex Table for Writing Task 1

Download a word doc of this table by clicking: IELTS Complex Table

IELTS Table Writing Task 1 Complex Lots of Data

Source: IELTS Liz

Band 9 IELTS Complex Table Model Answer

Note: this model answer was provided by Tony Grace, experienced IELTS tutor.

The tables illustrate the proportion of people assessing six aspects of one city’s life as good, average, or bad, in 1980 and 2010.

Overall, healthcare, education, and the environment were given the highest scores in both years, and transport facilities received the lowest.  Meanwhile, education’s rating rose over the period, while that of transportation fell.

In 1980, people rated healthcare, education, and the environment the highest, with over 80% approving of healthcare, while the other two had figures of 72%.  Under 10% of respondents thought these three services were bad.  As for shopping and unemployment, both had similar figures, as 62-64% expressed approval, and 22-24% said they were average.   Only a half of those surveyed gave a high score to transportation, with roughly a third stating it was bad.

Turning to 2010, the most significant changes were seen in education, as over 80% were happy with it, and in healthcare whose good rating fell to 74%.  The employment situation improved, as in 2010, almost three-quarters of those asked expressed satisfaction.  In contrast, approval of the transport facilities fell to 39%, and a similar proportion stated it was bad.  Finally, with regard to the environment and shopping, their approval levels both remained relatively unchanged.

Recommended for IELTS Writing Task 1

FREE SUBSCRIBE

Subscribe to get new lessons & tips by email.

.

Useful Links for IELTS Line Graphs in WT1

Useful tips and link for vocabulary, content & paragraphs for IELTS writing task 1 line graphs.

Below I have listed some useful links to learn about IELTS line graphs. Line graphs are quite common in IELTS writing task 1.

There are six types of IELTS writing task 1 for the academic paper:

  1. line graph
  2. bar chart
  3. table
  4. map
  5. diagram
  6. pie charts

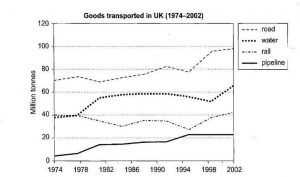
Sample IELTS Line Graph

Source: IELTS Cambridge English Test Books

You must prepare for all types of charts in academic writing task 1. You might also be given a combination of a line graph with a table for example. Writing task 1 is worth about 33% of your total writing marks so it’s worth learning well.

Tips for IELTS Line Graphs

Here are some useful tips for Line Graphs:

  1. Introduce the time frame and individual categories
  2. the overview will contain the main trends over the whole period  – a bird’s eye view
  3. use language of change for line graphs: increase, drop, fluctuate etc (see below)
  4. vary your sentence structures: “the number of sales decreased over the period / there was a decrease in the number of sales …”
  5. support sentences in the body paragraphs with data – time frame and numbers
  6. don’t spend more than 20 mins on task 1
  7. make sure you have four paragraphs (occasionally five are possible)
  8. don’t overload your writing with small details – be selective
  9. aim for between 160 and 180 words
  10. task 1 is a report, not an essay

IELTS Line Graph Lessons

Click on the links below to access the pages to learn about line graphs:

Get my free lessons by email

Subscribe for free to get my new IELTS lessons sent to your email inbox.

WT1 Table 30th Sept: To be completed

You can find a student’s copy of the writing task 1 table from 30th September (2 days ago)  in the link below:

However, the table is not accurate and it has not been completed.

If you took the test on Sept 30th, please can you complete the table and email it to me? ieltsliz789@gmail.com. That way, I will be able to write a model answer for it.

Word Doc: WT1 Table 30 Sept Incomplete

Thanks

Liz

Where can you plan your essay for IELTS writing?

Hi guys,

A lot of students have asked me if they can get extra paper to write a plan for their IELTS writing task 1 and writing task 2. They want to know what paper they can use for planning.

Planning is an essential part of your writing. 50% of your marks is based on choosing information, deciding how to present it and planning organisation. This means all ideas need to be planned in full before you start writing. See this page about Tips for IELTS Essay Planning.  You can find the marking criteria for writing task 2 on this page: IELTS Writing Task 2 Band Score

Where can you plan your essay?

The answer is that you use your question paper to write your plan.

At the end of your test, you will hand in your question paper. BUT the examiner will not see it and it will not be marked. So, you need to use the question paper to plan your writing for task 1 and task 2.

Please share any of your tips or experience for essay planning in the comments box below:

error: Content is protected !!