Here is an IELTS line graph sample answer describing two lines. You must fill in the gaps to complete the model writing task 1. Answers are given below. If you wish to learn more vocabulary for a line graph, follow the link.
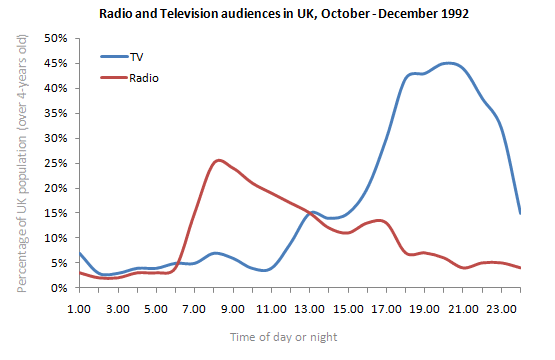
The line graph below shows radio and television audiences throughout the day in 1992.
Source: Graph below was not designed by IELTS Liz. Source unknown.
Line Graph Sample Answer
Fill in the gaps to complete the sample answer for the above line graph. You can use more than one word in each answer.
The line graph illustrates the (1) ………………………… of people listening to the radio and watching TV who were over the age of 4 in (2) …………………… period, in the UK from October to December 1992.
Overall, the (3)…………………….. of people listened to the radio in the morning while (4)………………. people watched TV in the evening. Over the 24 hour period, there were more people watching TV than there were listening to the radio.
(5)……………………. the TV, at 1am there were under 10% of people watching TV. This (6)…………………………… remained relatively (7)…………….. until 11am when there was a (8)……………. increase in people watching TV before (9)………….. at approximately 45% at around 9pm. After that time, there was a (10)…………… drop in viewers to under 20% by midnight.
Similarly, the percentage of listeners to the radio also began low at under 5%. After continuing at under 5%, the figure then rose (11)……………… to a (12) …………. of almost 30% at about 8am. From that point, the proportion of audience (13) ………………. in a gradual (14)……………… trend to 5% at the (15) ………. of the day.
Answers- proportion / percentage
- a 24 hour
- majority
- most
- Regarding / With regard to / In regard to
- figure
- stable / constant
- steady / gradual
- peaking
- sharp / rapid / dramatic / sudden / considerable / significant
- sharply / rapidly / dramatically / suddenly / considerably / significantly
- peak / high
- fluctuated
- downward
- end
Recommended
- Line Graph Vocabulary
- Line Graph & Bar Chart Model Answer
- ALL MODEL ANSWERS & TIPS FOR WRITING TASK 1
.


The line graph demonstrates the proportion of British residents aged over 4 watching TV and listening to the radio over a 24-hour period between October and December in 1992. Units are measured in percentages.
Overall, the majority of British people listened to the radio in the morning, while more people watched TV in the evening. Furthermore, there were more people watching TV than listening to the radio over the 24-hour period.
Regarding radio audiences, the figure started marginally below TV viewers and remained steady at around 3% from 1am to 6am, before surging dramatically by around 22 percentage points in the following two hours. The two lines intersected at 5% at 6am, after which the radio numbers markedly exceeded TV numbers by 20 percentage points and hit a peak of approximately 25% at 8am. Following this peak, a downward trend emerged for the remainder of the day, falling slowly to 5% at 12am.
In terms of TV, before some significant fluctuations occurred, the audience rates stayed relatively stable from 1am to 11am, at roughly 5%. The proportion of TV audiences rose gradually to 15% at around 1pm. Despite a brief dip afterwards, the rates soared to a peak of roughly 45% at about 9pm. After reaching the peak, the number fell dramatically to 15% by midnight.
The line graph illustrates the trends in radio listeners and television viewers in Britain between October and December 1992.
Overall, the proportion of people who watch TV gradually increased over the period yet declined at the end. However, there was a climb in statistics for radio listeners that was never witnessed before. The graph stretches over three portions of the clock, morning, evening and night respectively. All the audience were above the age 4.
Initially television viewers were below 5% just over the radio listeners who were at the same between 1.00 to 3.00 in the morning. Both of them then started to increase between 5.00 and 8.00 in the morning, however radio listeners spike the graph and reached its peak in the same time period from below 5% to around 25%.
On the other hand, television viewers fluctuated before experiencing a strong growth between 13:00 and 21:00 and reached their peak at around 45% yet went down by the end of period. Similarly, radio listeners experienced the same phenomena and declined after the peak at over the rest of period.
Hey Riz. Grateful for your presence to have this kind of prep material at home. I have tried writing this line graph without seeing model answer I know its not recommended but I just have to check my ability of understanding. Please highlight errors and weak areas I need to focus on, I have my test on 17th feb. Thankyou
My model answers are there to learn from. You can either read the model answer and then write your own to compare. Or write your own answer and then compare it to the model answer. When you compare your answer to my model answer, you will see what you need to improve. Look at organisation, paragraph content, language, linking etc
Hi Liz!
I am not sure how to explain myself clearly but ,while referring to the model answer I also thought why not to use help from AI . It is really helpful with catching grammar and spelling mistakes but some times it gives me writing recommendations that kinda sound weird to me , for example: viewership , audience share , radio listening peaked at , whereas , “attends TV is incorrect better say watched television “ , and more
Of course I am not going to follow AI blindly , though i want to know is this adjustments provided by AI makes sense? Or should I not rely on it further than catching minor errors?
AI can help with grammar and vocabulary, such as collocations, which are the match between noun and verb. However, AI is not without fault. It is possible for a sentence to contain an error and AI not recognise it. When it comes to IELTS, language accounts for only about 50% of your marks. So, AI can help to some extent (not totally) with the language aspect of your IELTS essays, but not with Task Response or Coherence & Cohesion, which together count for the other 50% of your marks.
Got it,thank you for your time!
Hello, thanks for the lesson
I have a question: As the task always says to provide comparisons, I thought that when we have only 2 categories we cannot describe them separately, cause we have to constantly compare them throughout the report?
Is it acceptable to write body paragraphs divided by periods?
The radio audience was more active than TV viewers in the morning, increasing sharply to about 27% at 8 am. This was followed by a significant decline, while the TV audience was completely inactive at 6 am and then grew with wide fluctuations, intersecting with radio listeners at 15% at 1 pm.
In the afternoon, the percentage of TV viewers was higher than that of radio listeners, reaching its peak at approximately 45% at 8 pm before declining in the following hours. Meanwhile, the radio audience continued to decrease, intersecting with the TV audience at around 2% at 2 am, with both figures remaining at this level until 6 am the following day.
Thanks in advance
Comparisons are used where relevant. Not all writing task 1 require comparisons. For example, in a diagram you don’t compare stages, you report stages one at a time, step by step. This is similar with line graphs or any chart that shows change over a period of time – you focus on each line which has different and separate trends in different time periods. If you tried to continuously compare a line graph, the report would be messy, illogical and confusing to read. For this reason, you provide a comparison of the lines in the overview (along with other key features) and then tackle body paragraphs more logically each line at a time. Remember, most reports are just about reporting what you see and comparisons are used when relevant and when useful – otherwise they aren’t used. But for most bar charts, some tables and many pie charts (not all), you will probably have more comparisons.
Thanks for your detailed answer, I really appreciate it
Hello Liz!
Hope you are well. As I am preparing to pass the IELTS, I found your website incredibly helpful.
Regarding the writing task 1, I have a question, as we write that “units are measured in …” in the introduction, would it be alright to never mention the units of measurement? For example, instead of writing “Pipeline presented a constant positive trend by reaching more than 20 million tonnes by 2002, with the initial start of about 5 million tonnes in 1974”, would it be okay to write “Pipeline presented a constant positive trend by reaching more than 20 by 2002, with the initial start of about 5 in 1974”? It just seems that I exceed the word limit, but without the units of measurement I stay within it. So my question is whether or not it will affect the coherence of the essay? I understand that I must follow the style, whichever one I chose, be it with or without.
Thank you in advance!
At no point do you mention the trends in an introduction, that information is for the overview, which is a very different and separate paragraph. Please go to this page: https://ieltsliz.com/ielts-writing-task-1-lessons-and-tips/, where you will see a video which will teach you how to write an introduction paragraph. Learn precisely how to write the introduction, and then review my model answers and practice lessons for the overview.
Oh no, the sentence that I’ve provided as an example was taken from one of the body paragraphs, the introduction only consists of the paraphrasing and the units of measurement. My question is, may I stop mentioning the units of measurement in the body paragraphs after I’ve indicated that “units are measured in pounds” as the second sentence in the introduction. May I write just 50 instead of 50 pounds in the body paragraphs, as I will provide numerical data to solidify the descriptions? Or is it mandatory to always indicate the unit of measurement?
I understand now. It is always best to show one number that has pounds as the currency in the body paragraph – the first number given. You don’t have to write formally “units are measured in …” for every paragraph, but reminding the reader subtly that we are referring to pounds is a good thing to do for any report.
Got it, thank you!
Hello, I’m a beginner in IELTS writing, so I’m just wondering if I can address the line instead of the number of people (and use the present tense for the lines), like for example: “Overall, both lines fluctuate dramatically” or “The radio audience line peaks at ….”?
Thank you, your content has been so helpful so far!
No, that’s isn’t an option. We don’t refer to a line as a line but rather to what the line is showing. So, “both lines fluctuated” would be “the number of people doing X fluctuated”. And “the radio audience line peaked at” would be “the number of people listening to the radio peaked at”.
Hello Liz, i’m here to say THANK YOU. I took my computer based academic test last week friday, i saw the result yesterday and i passed. Here is the breakdown..
overall 8.0
Listening 8.0
Reading 8.0
writing 7.0
speaking 8.0
All my friends wanted to know how i did it, i have directed them all to this site.
God bless you Liz. All the way from Nigeria…
Excellent score!! Very well done to you 🙂
Wow🤭. This is inspiring. If I may ask how many weeks did you prepare for? And was this website the only preparation aid you used?
I just started my preparation, I hope to do well too.
The line graph illustrates the proportion of British population of children over four years old that attend to radio and television, around 24 hours’ time in a day, between October and December 1992.
Overall, between October and December 1992, the proportion of British children’s population that attend to radio increase at early hours of the day, with television viewers decreasing exponentially, but as daytime progresses into early hours of dawn, radio audiences decrease with increasing television viewers. Although there are few hours where the percentage of both radio and television audiences overlapped, both audiences tend to decrease at late night.
Radio audiences recorded a higher percentage of about 25, between 7.00 and 9.00, with decreased and stable television audiences. A plummet was shown in television audiences to a percentage of about 45, between 19.00 and 21.00. This indicates that the time of the day technically determined the percentage of British children that attends to radio and television, although two hours in a day, 5.00 and 13.00 recorded no significant difference in the percentage of users.
Hey Liz, can we write the task in simple past tense? For example- “…illustrates the proportion of people who LISTENED to the radio and WATCHED television…”
Yes, that’s absolutely fine. Both of these sentences are in the past:
1. The graph illustrates the number of people listening to the radio in 1992.
2. The graph illustrates the number of people who listened to the radio in 1992.
Thank you so much
The given graph illustrates radio and television viewing routines of the UK population from October to December 1992.
Overall, television had consistently achieved a higher total viewership than the radio. The TV reached its peak viewership in the nighttime slot. While the radio had its peak listenership in the morning slot.
The radio’s listenership was at the lowest from midnight to 6am with fewer than 5% of UK population tuning in. Afterwards, it quickly rose in the morning reaching its peak at 8am by attracting about 25% of the people. It could be that the audience enjoyed hearing radio in the morning while having breakfast, travelling to their offices, and performing other chores.
Similarly, UK’s television viewership was also at its lowest in the midnight. It began to rise from 11am. Afterwards, it quickly picked up viewership and reached its peak at 5pm to 9pm. Post evening time, it engaged 45% of the population in their after-work leisure hours. This viewership fell quickly to almost 15% of the total after 9pm with the arrival of resting hours.
Lastly, when listenership of the radio began to decline, viewership of the television started to rise, showcasing the shift in audiences’ preferences with the changes in time slots.
The line graph compares the proportions of the British population over 4 years old who were entertained by radio and TV during the different time of the day between October and December 1992.
Overall, it can be clearly seen that in the morning people preferred radio, whereas TV was a more popular choice in the second part of the day with the highest amount of hours spent in the evening.
Starting at 1am, 7% watched TV, which was followed by a drop to under 5% until around 6am; the same pattern was observed for those who listened to radio. However, from 6am the proportion of radio audience soared to its peak at over a quarter 2 hours later, followed by a constant fall onwards. In contrast, the percent of TV audience inclined to around 8% at 8am and to nearly 15% at 1pm after a dip to under 5% 2 hours before.
Moving to the activities of the second part of the day, the proportion of radio listeners kept on falling to about 5% by the end of the day with some fluctuation between 15.00 and 21.00. On the other hand, the percent of TV audience experienced a significant rise to its peak at roughly 45% between 8pm and 9pm, which was followed by a sharp decline to around 15% by the end of the day.
The line graph illustrates the frequency of using TV and radio during a day in the UK from October to December 1992.
Overall, it can be seen that one activity alternates with the other one. In the first half of the day, the majority of the UK audience prefers listening to the radio, meanwhile, after 1 pm the number of TV users extremely goes up.
At 1 am, the percentage of the audience slightly rises and at approximately 6 am, it sharply climbs and hits a high of about 27%. Then, people start using the radio less and the frequency decreases – the percentage goes down, soon rises at 5 pm to around 15% and declines again, having some insignificant drops.
In terms of television, at 1 am, the percentage of users falls to 2%, then start rising, having some fluctuations. At 11 am, the frequency of using TV grows notably and reaches its peak at about 45% at 9 pm. Then, the percentage of TV users goes down.
The given graph illustrates the amount of audiences of radio and television in the span of 24 hours, this data has been collected from October to December of 1992 in UK.
We can see that in the period between midnight and early morning at 6 AM, the numbers of audiences are reaching the rock bottom with a value of around 5 % for both broadcasters.
when people begin to wake up to go to work in around 7 AM, numbers of radio audiences is wildly peaked and reached the highest point that it can go at around 25% of UK population, on the other hand television is still steady at 5%.
Throughout the day radio numbers is gradually step down and in contrast television is steadily increase until we reached the breakeven point at around 2 PM when television is outnumbering the radio because people is beginning to return from work.
In the final hours of the days, television reached its highest value of audiences in around 7 PM with nearly 45% of UK population, on the other hand radio is still at the rock bottom with only 5%.
We can conclude from this data is people tend to listen to radio while going to work and after returning home they begin to relax and watch tv until near their bedtime.
Hi Liz,
Thank you so much for those materials! They are really helpful for my IELTS test preparation.
I have a question. “The line graph illustrates the proportion of people listening to the radio and watching TV…” In this sentence, can I change proportion to proportions? and why?
I considered the plural form, proportions, because there were two categories of people. One category is people watching TV and another category is people listenning to radio.
Looking forward to your answer.
Thank you very much!
Sure, that’s fine. English grammar isn’t always black and white. In this case, both options are possible.
This line chart illustrates the proportion of tv and radio listeners in England (age over four years old) from October to December 1992.
Overall, the majority have presented as TV users, which is almost 45% at around 21 hours. Besides, these TV waivers gradually increased over the given time in a day. Around 11 its has slightly increased, up to 15% and then around 13.30, significantly increased up to 40%. Then instantly decreased to 15 present at midday or night. Although, around 1 to 10.30, we could see some slight changes in television viewers which is maximum goes to 6%.
In terms of British radio audiences, who were highly active around 8 p.m. or a.m., that is notable while it gradually decreases and maximum indicate 4% during the day after midday or night. Outstandingly, the Radio listening Percentage has increased up to 25 at 5.30, and it lasts till 7.30. Then after, it eventually falls to likely 10%. Later 13.30 diagram shows some slight differences until the rest of the day.
Likewise, we can see the Highest proportion of British children who tend to watch TV rather than listening to the radio in 1992, the period given. According to the chart, The proportion of children who had been watched TV is twice as much as people who were listening to the radio.
The graph line presents the British television and radio audience throughout the average day between October and December in 1992, which the percentage of UK population (over 4-years old) and the timeline from 1 a.m. to midnight are the vertical and horizontal values respectively. The TV and radio graph lines are compound of blue and red line colors each. At the beginning, The TV and radio audience had similar samples motions within a range of 2.5% to 7%, in which, TV watchers had obtained a slight lead from 1 a.m. to 6 a.m with 1% more.
Whereas the TV audience kept going its pace until 11:30 a.m., the listeners turned their radios on and abruptly reached to its hearing peak with a quarter at 8 a.m. Nevertheless, the listeners had started to gradually descend from this time and reached to the least mark of 5% at the end of the day.
On the other hand, the TV audience had 2 increases, firstly it had started to gradually go up from 11 a.m. to 2 p.m. reaching to 16%, secondly it hugely raised from 3 p.m. to 6 p.m. and achieving its peak with 45%, almost the half country population were watching the TV services at 8 p.m. However, it started to quickly go down just after 9 p.m and closed the graph with 15% at midnight.
Dear Liz, I tried doing the exercice and my exam is next week, i was hoping if you could give me a general feedback at my trial please. Thank you
The line graph demonstrates the proportion of british citizens that are entertained by either the television or the radio, over the course of the day, from October to December in 1992.
Overall, the percentage of television viewing exceeds the radio’s frequency, specifically during the second half of the day. Conversely, the proportion of people listening to the radio falls remarkably from the afternoon till the end of the day.
From 1 am to 6, the usage of both modes of entertainment is trivial with an average of only 5%. On one hand,, the number of people listening to the radio increases sharply at 6am, to reach its peak (25%) at almost 9 am. On the other hand, during this period, the percentage of Tv viewers remains steady at 5%, which is followed by a dip at 11 am. In the afternoon, the Tv and the Radio occupied a similar importance with a proportion of approximately 15%. However, from 13, the number of radio listeners fell gradually with a few fluctuations, until it reached 5% at the end of the day. Whereas, during that time the percentage of the population watching the TV grew dramatically and it reached its peak at around 20 with a percentage of 40%. During the end of the day, a steep decline in the television’s audience can be observed, as viewing decreases by almost 25%.
Sorry I don’t comment on writing.
The graph illustrates the audiences of TV and radio period 24 hours between Oct and Dec in 1992 in UK.
Overall the radio unchanged from 1:00 AM to 6:00 AM but increased dramatically in 7:00 AM although after 3 hours drop to 26%. Likewise, in TV in morning duration it hadn’t changed until 8:00 AM rise to 6% which have decreased in 10:00 AM.As we see in TV is rises especially in evening whereas radio rocked in the morning.people almost reach to 50% between 16:00 PM to 21:00 PM which start to drop to 30% in the following hours.
In the whole, the chart despite that in 13:00 PM both get to 15% but after an hour radio fall to 12% also decrease again to 10% in 15:00 PM. Although radio had fluctuate after 15:00 PM.which explain that people prefer watching TV in the evening until midnight even though 6% of people watching in morning.Despite of this that the most people as the graph shows they rather to listen to radio in the morning they reach to 25% in this percent was the highest one of radio.
dear Liz could please tell me which the expected band can get it in IELTS.
Thank you very much
Dear liz,
I did the Ielts couple days ago, on the writing of task 1 I wrote the whole structure which includes intro by paraphrasing the question and in the over view I wrote that “Overall, USA has the highest number of immigration as posed as Australia has the lowest number of immigration while USA has the highest number of immigration for the the whole period whereas Australia has the lowest number of immigration “. Plus paragraph one I explain every year separately there was 11 years on the graph that is given + one sentence of paragraph 2, with using translation words in the whole task. On the other task or task 2. I wrote the almost the same intro as yours with including 2 or 3 high level of vocab it was about 100 words it took most of the first page. first I mention brief intro about the topic than a brief intro about what should I include than my opinion after that what I will include in the whole task. The paragraphs was containing (brief intro, thesis, one or two (complex or compound sentence)and full of simple sentence the result than a small conclusion).
So please could you estimate my mark according to what I have said.
Your score is based on Task Achievement, Coherence & Cohesion, grammar and vocabulary. Your writing is analysed in great detail to decide a final score and is not based on a simple description of what you have done. You must wait for your results to see your score. However, I will say that an introduction which is 100 will not help your score. An introduction is usually 40 – 50 words.
Dear Liz,
please how do you count words in ielts writing task?
One at a time. Each word counts as one word – one after another in order.
Namaste, from Nepal
Dear Liz, we were taught to write conclusion in writing task 1, but i don’t feel comfortable with it as we mentioned same things in overview. What should I do?
Never repeat information. Task 1 is not an essay. It is a short report. All key features are reported in an overview and should not be highlighted again. The body paragraphs present the details (usually data).
Thank you a lot!
Hellor Liz, thank you so much for this amazing website.Much appreciated . With regard to writing task 2, I seem not to find any other lessons apart from writing Introduction and Thesis statement.Can I get a link to the rest of the lessons for writing task 2?.
Thank you!
Look at the red nav bar at the top of this website. You will see links to all the main pages on that red bar. Click on the writing task 2 section to find a lot more posts, model answers, tips, videos etc.
Minh Hoa says:
Hi Liz,
I am not good at analyzing charts, tables to do IELTS TASK 1 . Could you really help?
Regards,
Hoa
Sorry for the delay in replying. See this page: https://ieltsliz.com/ielts-writing-task-1-band-scores/ for tips on improving.
Thank you mam,
Can you give me any instruction or link abut the use of preposition?
Thanks in advance.
See this page: https://www.ego4u.com/en/cram-up/grammar/prepositions
Liz
Thanks
Very useful link for IELTS students.
But there were a limited discussions about article (a, an, the).
Can you provide me any link regarding article use?
Thank you for your time.
See this page for links: https://ieltsliz.com/useful-websites-and-resources-for-ielts/
All the best
Liz
Hi Liz,
Your lesson is very useful.
Regards,
Hoang
Hi Liz,
Is this sentence acceptable?
There were more people watching TV than listening to the radio
Yes, it’s fine.
Hi Liz,
Can a conclusion be avoided altogether in task 1 academic
I’m confused!HELP
There is no conclusion in writing task 1. Please see my writing task 1 section to learn more.
Thanks
Liz
Hello Liz
Your teachings have been of great help to me.I am presently preparing to take my test by the month end.Please how do I get my essays and reading practices assessed?
Unfortunately, I don’t offer any marking services. On this blog, all reading practice exercises have answers. If you want to practice full reading tests, you should get the IELTS Cambridge books 1 to 10 (number 10 is the most recent). They are books with real exam papers published by IELTS. For writing, you will need to find an IELTS teacher to help you with assessing your level.
All the best
Liz
Dear Liz,
What’s the difference between “In regard to” and “With regard to”? Aren’t these the same in grammar and meaning?
Would be so kind of me by explaining it.
With regards,
Mohan Anbgo
There is no difference. They are both acceptable and both grammatically correct.
Liz
Liz, how about in behalf and on behalf of?
Please check this link: http://www.grammarphobia.com/blog/2006/09/in-behalf-of-vs-on-behalf-of.html
Liz
Hi Liz..
All ur tips & lessons are truly amazing. Most important it really helping me to practise all the levels of writing task1..I really hope my real test goes well n score expected bands 🙂
I agree completely!