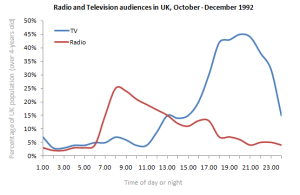
Learn how to describe a line graph for IELTS writing task 1. IELTS Line graphs are common in writing task 1 along with bar charts, tables, maps, diagrams and pie charts. This lesson was last up-dated in 2018.
The guidelines below will help you structure your line graph answer and focus on the right aspects for a high score.
Steps: How to write IELTS Line Graphs
- Have a clear introduction.
- try to include all information from the two axis and the names of categories.
- Put all main trends in an overview statement – this should be contained in one paragraph.
- do not divide your key points into different paragraphs. Make sure you include the main increases and decreases shown.
- Use a range of vocabulary and do not make spelling mistakes.
- Use different verbs and nouns
- Use a range of adjectives and adverbs
- Vary your time phrases
- Click here to get a word list: LINE GRAPH VOCABULARY
- Don’t always give from … to … for the amounts, sometimes you can give the difference “it increased by double..”.
- Put numbers or percentages to support your sentences in the body paragraph. Failure to do that will result in a low score.
- Organise your body paragraphs logically so it is easy for the examiner to read.
- Leave an empty line between paragraphs to make them easier to see. This is not a rule, it is a strong recommendation.
- If the line graph contains many lines and a lot of movement, be selective. You are being marked on your ability to select key features.
- Don’t spend more than 20 mins on task 1. You will need a full 40 mins for task 2.
- Write 150 words or more. Aim for about 160-190 words. Don’t write under the word count.
- Follow well-written model answers.
- Click here: IELTS Writing Task 1 Model Answers
Line Graph Sample
It is not common to be given only one line in IELTS writing task 1. However, this answer will provide you will an example of vocabulary, layout and general content.
- Source: IELTS Liz
Line Graph Model Answer
The graph illustrates how many people from the age of 65 and above were reported to have contracted influenza in a particular village in the UK from 1985 to 1995.
Overall, the number of cases of elderly people with influenza increased over the period given. The highest number of people with the illness can be seen in 1991.
In 1985, the number of cases of influenza stood at 40 and then rose steadily over the next three years to reach 55 in 1987. In the following year, 1988, the figure dipped slightly to below 50 after which it rose significantly to reach a high of 75 in 1991.
From 1991, there was a decrease to about 60 in 1993 of the number of reported cases of influenza. From this point, except for a slight increase of about 5 cases, the number remained at about 60 at the end of the period.
151 words
Focus Points:
Take time to read through the model and pay attention to:
- the content of each paragraph
- the use of verbs, nouns, adverbs and adjectives
- the logical order of information in the body paragraphs
Please note: this is a practice exercise lesson. It is rare for IELTS to give a one-line graph. So, use this to practice language and technique.
Recommended
- IELTS Writing Task 1: Tips & Model Answers
All the best
Liz


