Useful tips and link for vocabulary, content & paragraphs for IELTS writing task 1 line graphs.
Below I have listed some useful links to learn about IELTS line graphs. Line graphs are quite common in IELTS writing task 1.
There are six types of IELTS writing task 1 for the academic paper:
- line graph
- bar chart
- table
- map
- diagram
- pie charts
Sample IELTS Line Graph
Source: IELTS Cambridge English Test Books
You must prepare for all types of charts in academic writing task 1. You might also be given a combination of a line graph with a table for example. Writing task 1 is worth about 33% of your total writing marks so it’s worth learning well.
Tips for IELTS Line Graphs
Here are some useful tips for Line Graphs:
- Introduce the time frame and individual categories
- the overview will contain the main trends over the whole period – a bird’s eye view
- use language of change for line graphs: increase, drop, fluctuate etc (see below)
- vary your sentence structures: “the number of sales decreased over the period / there was a decrease in the number of sales …”
- support sentences in the body paragraphs with data – time frame and numbers
- don’t spend more than 20 mins on task 1
- make sure you have four paragraphs (occasionally five are possible)
- don’t overload your writing with small details – be selective
- aim for between 160 and 180 words
- task 1 is a report, not an essay
IELTS Line Graph Lessons
Click on the links below to access the pages to learn about line graphs:
- Nouns and Verbs for IELTS Line Graph
- Adjectives and Adverbs with Tips
- both the above links provide useful language to describe the changes in a line graph.
- Gap Fill Practice for Line Graph
- Two Lines Model Answer Exercise
- both the above links are exercises to practice using language for line graphs.
- Three Lines Model Answer
- Line Graph & Bar Chart Model
- both model answers above will help you understand more about describing line graphs
- Practice Charts for Academic IELTS Writing Task 1
- All my IELTS Writing Task 1 Tips & Model Answers


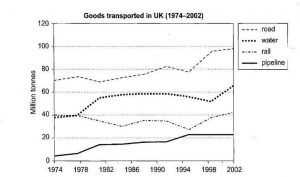
The line graph illustrates the quantity of goods through road, water, rail and pipeline from 1974 to 2002 in United Kingdom. Units measured in tonnes.
Overall, the amount of goods transported through different sources include road, water and pipeline increased dramatically over the entire period. Whereas source like rail remain relatively unchanged.
Initially, goods transportation of water and rail starts around 40 million tonnes in 1974. with some fluctuation the goods transportation of water and rail ended up with 70 and 40 million tonnes respectively.
On the other hand, goods transportation from road and pipeline increases from 70 million tones and 5 million tonnes in 1974 to 97 million tonnes and 21 million tonnes in 2002 respectively.
The graph illustrates the volume of goods transported within the UK via four modes of transportation—road, water, rail, and pipeline—between 1974 and 2002. The units are measured in million tonnes.
Road transport consistently carried the largest volume of goods throughout the period, starting at approximately 70 million tonnes in 1974 and increasing steadily to over 100 million tonnes by 2002. Water transport also showed an upward trend, rising from around 40 million tonnes in 1974 to roughly 65 million tonnes in 2002, despite some fluctuations.
Rail transport experienced slight variations over the years but remained relatively stable, starting at about 40 million tonnes in 1974 and ending at a similar level by 2002. In contrast, pipeline transportation accounted for the smallest share, starting at under 10 million tonnes in 1974 and increasing modestly to around 20 million tonnes by 2002.
Overall, the graph demonstrates the dominance of road transport, while other modes of transportation showed slower growth or remained stable.
When people put the overview at the end of their report, it becomes like a conclusion – short and sometimes with repeated information. This is wrong. For an IELTS report, the overview is the most important paragraph. A limited, short overview as you have written will limit your score. Always focus on the overview and make sure you have ALL key features in it. See my model answers to learn the length and content of the overview paragraph: IELTS Writing Task 1 Answers & Tips
Please anyone provide me a band. Is it necessary to explain every detail.
The line chart provides information about the amounts of goods transported in Britain via roadways, waterways, railways, and pipelines between 1974 and 2002. The x-axis represents the year and the y-axis represents the quantity of goods in million tonnes.
Overall, throughout the period, the most prominent mode of transportation was roadways. Additionally, pipelines were the least predominant way through which goods were transported. Initially, railways were more popular than waterways; however, waterways became more significant from 1978.
The quantity of goods transported through pipelines increased significantly from 3 million tonnes in 1974 to 22 million tonnes in 1994 and till 2002, it remained constant. Moreover, in 1974, approximately 39 million tonnes of goods were transported through waterways. In addition, the number increased continuously and roughly 60 million tonnes of goods were transported around 1990. However, there was a fluctuation, the count reached 52 million tonnes in 1998 and again surged to 65 million tonnes.
In 1974, railways were used to transport 40 million tonnes of goods. Its figures fell continuously and only 30 million tonnes of goods were transported. but, it reached a peak at 42 million dollars in 2002. Evidently, the quantity of goods transported through roadways climbed rapidly and around 98 million tonnes of goods were transported through that mode.
Although my website doesn’t provide a feedback service, I will make a quick comment.
1) You don’t need to write “This x-axis represents …”. That sentence is not needed in IELTS writing task 1. If the amount of goods is measured in millions of tonnes, put that into a clause in your first sentence.
2) In your overview, writing that waterways became more prominent over the period isn’t actually a key feature. That increase was not more significant than any of the others. So, you would be marked down on highlighting something that shouldn’t be highlighted. As this is a line graph, you should be saying which lines went up and which went down over the period. So, for this graph, all modes of transport increased, except rail which decreased slightly before returning to it’s original figure.
3) As three of the lines increased and only one didn’t, that will form your structure for the body paragraphs. Put lines with a similar trend together in one body paragraph.
4) Be careful writing “roadways”, you should be writing “roads”.
The line graph illustrates how many goods were moved by road, water, rail and pipeline in the UK between 1974 and 2002. All units are measured in million tonnes.
Overall, the highest volume of transportation was by road in the UK during the period given, compared to pipelines, which had the lowest. Additionally, all modes of goods transportation showed an increasing trend over the period, except for rail, which fluctuated.
The volume of goods transported by road started at around 70 million tonnes in 1974 and rose to just under 100 million tonnes in 2002. Likewise, transportation by water increased during the period given, rising from approximately 40 million tonnes in 1974 to nearly 70 million tonnes in the final year.
Although pipelines had the lowest volume of transportation, this figure showed an increasing trend during the entire period, starting at around 5 million tonnes and rising to slightly over 20 million tonnes by the end of the period. In terms of rail, the amount of transportation started at 40 million tonnes in 1974 and fluctuated between approximately 35 million tonnes and 40 million tonnes throughout the period.
The chart illustrates the number of goods transported in the United Kingdom over 28 years, from 1974 to 2002. Units are measured
in million tonnes.
Overall, it can be seen that road transport consistently carried the highest volume of goods throughout the timeframe given, whereas pipeline accommodated the least. Additionally, there was an increase in the amount of goods transported via the different modes except rail which varied.
The amount of goods via road transport began at 10 million tonnes in 1974 before it peaked at around 90 million tones in 2002, with a noticeable upward trend. A similar grouth was evident for water transportation,
second after road. Initially, it transported approximately 40 million tonnes of goods in 1974,
although there was a gradual increase in the number to about 65 million tonnes in 2002.
Rail, at 40 million tonnes in 1914, fluctuated
over the given timeframe, but generally maintained a consistent level settling at just over 40 million tonnes in
2002. Lastly, pipeline carried the least number of goods at around 5 million tonnes in 1974. Nevertheless, the amount increased to slightly above 20 million tonnes around 1994 and, remained constant until 2002.
Hello, Liz.
I had a question regarding the accurate description of data. You explained in your video that if we do not see the exact number in the chart we should not write an assumed number e.g., if the y axis has 20 and 10 and the line graph has a point right between the two, in such a case should I write “around 15” or use terminology like “midway between” or “well below 20”?
It isn’t quite so simple. If the number which is very clearly precisely between 10 and 20 is obviously 15, then you can write 15. But sometimes it really isn’t possible to say precisely and in such a case you use “about” or “just over”. However, we don’t usually use “midway between”.
Understood. Thank you so much 😀
The line graph illustrates the different weight in millions of tonnes delivered in the UK using road, water, rail, and pipeline. The chart compares data gathered from 1974 to 2002.
Overall, the figures increased for road, water, and pipeline over a 28-year period of study. It is also clear that the records for rail showed fluctuation. Road peaked and carried the heaviest in 1998, while pipeline conveyed the lightest among all transports.
In detail, road operation started at around 70 million and plateaued until 1986. The pattern significantly changed when it surged to 90 million in 1998. By comparison, pipeline utilization initially was at its lowest in the first 4 years and steadied at around 20 million in the last 8 years. In the final year, deliveries through roads were utilized 18x more than pipeline in 1974.
The use of water as mode of transport gradually progressed from just below 40 million to more than 60 million in a span of 28 years. In contrast, rail transport dropped slowly from 40 million to 30 million prior to an irregular pattern seen between 1982 and 2002. During this time, the numbers interchanged between 30 million and 40 million.
The line graph illustrates the frequency of using four different means of product transshipment (road, water, rail, and pipeline) over the given period of 28 years (1974-2002).
Overall, both in 1974 and in 2002, the most and the least used transportation methods were road and pipeline, respectively.
Between 1974 and 1978, about four million tonnes of goods were transported by pipeline, meanwhile, the frequency of use of the road method was much higher – around 70 million. Then, since 1978, even with some fluctuations, there was kind of increase in the use of both means: in 1996 about 80 million tonnes of goods were transported by road and about 21 by pipeline. Pipeline use has stayed stable in the final years, but the number of goods transported by road hit its high – about 100 million tonnes.
In terms of water and rail, 40 million tonnes of goods for each transportation method were transported from the start. Anyway, the water transportation method was used more – it was going up slightly, there was a decline in 1998, but in the final year, about 65 million tonnes of products were transported by water. During that time, the number of goods transported by rail was decreasing, but in 2002, it was almost back to its starting value.
Thank u Liz❤️ it is very helpful 😊
You’re welcome 🙂
The chart illustrates four different means of products transportation in UK, including roads, water, rail and pipeline from 1974 to 2002.
Overall, it is clearly evident from the chart that the road was the most important means of transportation among the four, meanwhile pipeline was the least important. Water and rail way were 2nd and third in the list.
In the year 1974, about 74 million tons of goods were conveyed through road. This figure experienced fluctuation in the next 21 years, it reached to 80 million tons in 1992 and then peaked to 99 million tons in 2002.shifting of goods through water and piples experienced the same ups and downs .water ways started from 39 tons in 1974 and pipeline began from 5 tons in the same year. In the year 1987, the former increased to 60 tons and in the year 1995 the latter moved up to 23 tons. In the last year, water ways maximized to 62 tons, and the pipelines remained unchanged.
However, the shifting of goods through the railways did not show any significant changes over the given period of time. It started with 40 tons in 19974, moved down to 37 tons in 1988 and in the final year it came back to approximately 40 tons.
very well written….really helped me
The given line graph presents information on carried products in the UK using four different means of transportation (road, water, rail, and pipeline) over a period of 28 years. Units are measured in million tonnes.
It is clear that the road was by far the most important means of transportation over the period shown. Meanwhile, pipeline was used the least in each year, compared with the water and the rail ways which took place in the given graph in terms of usage second and third positions respectively.
In 1974, about 70 million tonnes of goods were transported by the road whereas more or less 40 million tonnes taken by water and rail ways and just about 5 million tonnes of product shipped by pipeline. Just four years later, water way overtook the rail ways and rose dramatically, just under 60 million tonnes in 1986 then remained stable until 1994, in the final years of the period the figure reached it is peak at 65 million tonnes.
On the other hand, indicator for the rail ways experienced slight fluctuation between 40 to 30 million tonnes and remained at this level for the rest of the period. By contrast, the pipeline rose steadily the figure was just above 20 million tonnes from 1994 to 2002. Likewise the amount of goods transported by road increased gradually from 1982 over the next two decades to peak at approximately 98 million tonnes.
The line graph illustrates the number of units of goods transported in the UK through 4 modes (road, water, rail, pipeline). Data was collected from the year 1997 to 2002. Units are measured in tons.
The supplied information showed maximum units of goods carried through the road transportation among the all 4 modes in a given period, and use of road transportation for goods increased from 67 units in the year 1974 to 99 units by the year 2002. And the lowest among the various mode of goods transportation was a pipeline, from 5 units to 25 units, in a given period, from the year 1974 to 2002.
We can observe the goods shifted through the water transportation, dramatically increased against railway’s transportation, it was initially 38 units in the year 1974, which was less than the railway’s mode 40 units, however from 1978 products moved through waterway increased to 65 units, whereas railway used for 42 units of goods movement in the year 2002.
To sum up, road transportation was always the top priority for goods transportation due to many factors. However, it is not good for the environmental aspect we must focus on using other alternatives more which are good for the environment.
The line graph demonstrates a comparison between the quantity of goods transported via four different transportation modes in UK (road, water, rail, pipeline) over 18 years, in the period between 1974 and 2002, units are measured in millions of tones.
in overall, roads seem to be the most popular way to transport goods through the period given, as opposed to pipelines which were least favorite to transfer the goods, and this figure continued at the same trend till 2002. On terms of transferring goods via water and rails, we can notice that in 1974 rails usage was slightly higher than water , but this trend reversed through the years and carrying good through sea water became more trending .
more detailed outlook at the graph ,the quantity of goods transferred via roads was slightly over 70 million tones in 1974 and this amount steadily increased through years to reach almost 100 million tones in 2002, compared to pipelines usage which transported only less than 10 million tones of goods in 1974 and similarly continued at this low rate of transportation to reach almost only 20 million tones of goods in 2002.
On the other hand, transporting goods via sea started at low rate of slightly lower than 40 million tones in 1974 but increased steadily with little fluctuations to reach over than 60 million tones in 2002, furthermore, rails being used as mode of transporting goods in UK started at about 40 million tones in 1974 , but this rate decreased slightly with a lot of fluctuations to reach the lowest point in 1994 which was almost 30 million tones , but using rails eventually increased again to reach more than 60 million tones in 2002
The line graph illustrates the items that were transported in million tones using different modes of transportation such as road, rail, water and pipeline in 8 years from 1974-2002 In the Uk.
Overall, all the transport mediums showed an increasing pattern in the number of goods they transported within the given time period. However, road was the most popular means of transportation of goods whereas pipeline was the least preferred.
In the beginning of the year 1974, 70 million tones of goods were carried by road. This figure increased steadily though with some little downward fluctuations after 1978 and 1990. By the end of the period, nearly 100,000,000 tones of items were transported using this medium. Movement of products using the Pipeline started of at about 5 million tones and increased steadily till 1982, where the number of goods that were carried by pipelines leveled off at nearly 20 million tones, before increasing again to 21 million tones. After this, it remained constant till 2022.
In regards to commodities carried by water and rail, Ferries and trains transported about 40 million tones of goods. However, ferries shipped more goods than railway accounting for the sharp increase in number of goods carried (around 59 million tones) in 1982. Following this, the figure remained somewhat constant at almost 60 million tones, up until 1994 where the goods transported decreased a bit, before rising above 60 million tones in 2002. For railway, which started of around 40 million tones, the number of goods transported showed a constant decreasing pattern with some fluctuations; until it reached just 25 million tones in 1994. After which, it rose drastically in 2002, slightly superseding the number of goods they transported in 1994.
The graph illustrates the transportation of road, water, rail and pipeline in the UK from 1974 to 2002. Units are measured in millions of tones.
Overall, while roads are always the most transported of all the goods, pipelines are always the least transported. Both water and rail had nearly the same amount of transportation for over four years until the first one continued growing while the second one decreased.
Road transportation was almost constantly increasing for over all the period. After 1990 it had a sudden decrease until it recovered and continued rising, reaching a peak of almost 100 million tonnes in 2002. It can be seen that pipeline transportation had slightly increased around the years. It more than doubled in transportation from over 1 million tonnes to over 20 millions tonnes.
Even though Rail transportation decreased during a long period, as it presented a sudden increase, by 2002 it reached almost the same amount of transportation that had in the beginning (over 40 millions tonnes). Water transported remained constantly for many years until it climbed gradually by 2002, after dropping to about 50 millions tonnes in 1998.
The graph illustrates the number of men and women that had gym memberships between 1980 and 2010. It shows how the number of people who signed up for the gym changed over a 30 year period.
Overall, the trajectory of the people that attended to the gym differed for males and females from 1980 to 2010. In 1980, the number of men who had a gym membership was almost twice as much of women that had the membership. By the end of 2010, however, the opposite happened in which twice as much women were signed for a gym compared to men.
With regards to males, there were 2000 people that had a gym membership in 1980. In the following 5 years, twice as much men had a gym agreement which again fell significantly until the end of 1995. The number of men that had decided to go the gym made a peak in 2005 with approximately 5000 people. The numbers, however, declined sharply to under 1000 men at the end of 2010.
In terms of females, 1000 of them started to go to the gym in 1980 but the number rose to almost 3000 people in the next 15 years. Until 2010, the number of women that agreed to go to the gym had consistent fluctuations between 2000 and 3000 people.
if you see any false in my answer please reply me
The line chart gives us the trend of products transfered in the UK between 1974 and 2002.
In general, road was more popular transition than other transitions. Pipeline was less preffered transition among all of which were water, rail and road. Water transitions saw an initial stability with rail in 1970s then they seperated over the period.
When looked in detail, roadway carried about 70 million tonnes of products at 1974 and increased significantly to under 100 million tonnes. The trend of pipeline started at about 0 million. The figure increased slightly to 20 million tonnes of products.
It ıs clear that, railway and waterway started at the same million tonnes of products which was 40millions.Water transitions started to climb in 1978 and stood at just over 60 million tonnes in 2002. The railway saw fluctuations. In 2002, railway transfered just over than 40 million tonnes of products in the UK.
total word: 153
The rendered chart explains the consumption of four kinds of meat in a European country from 1979 to 2004. the span of 25 years, which 1979 to 2004 is showing volatility in meat consumption.
Looking at the graph, the fish consumption was always lower than others, but the consumption of fish looks very steady degrowth, in 1979 the consumption of fish was above 50 grams per person per week that is the highest consumption in the span of 25 years.
Moving to the consumption of lamb showing steep degrowth from starting years of span. In 1979 it was 150 grams per person per week, however, till 2004 it has been almost 65 grams per person per week.
Only one product which we can see the steady growth in the span of 25 years is chicken. consumption was 150 grams per person per week in 1979 and it had been almost doubled in 2004. the consumption was in 2004 250 grams per person per week.
Looking at the graph of beef shows heavy volatility. in 1979 it was around 210 grams per person per week than we can see steep degrowth in almost 2 years of starting, after 2 years it shows a spike towards upside till 1984 then it shows continuously degrowth till 2004.
In the conclusion, the chart shows that 3 products fish, lamb, and beef constantly going down. while the consumption of chicken shows a continuous growth in the span of 25 years.
that is my first time for writing task 1.
dear LIZ
in the computer delivered IELTS, how do i use indentation? or does it not matter?
For both paper based and computer based tests, it is better to leave one line empty between paragraphs rather than indent.
The line chart give us the trend of products transfered in the UK between 1974 and 2002.
It can be seen that, The road followed upward tread, While the pipeline followed downward tread.
The frist of the period, The good transported in UK pipeline, In 2074 was 0% Rates, Afterwords In 1974 between 1990 Upword tread the rates of pipeline percentage above 20% Then Fainally In 1994 to 2002 end the percentage rates last of 20%. While The rail station In 1974 was 40% Rates, However rapidly downward tread in 1986 above 20%
day by day fall the line and the end of time again Upword tread also stopped above 40% in 2002. In the next step In 2074 the water rates was 40% However The water day by day and increased and booming rapidly in the last of the time stopped 60% in 2002 .In addition the last of stape percentage rates frist of the time it was higher position , In 1974 above 80% Although gradually it increased day by day and last of the time it stopped the massive highest percentage 100% in 2002. So the most of time in 4th stape highest quality percentage rates road, In addition the less rates pipeline!.
the line graph illustrates the quantity of goods that were moved through four different means of transportation(road, water, rail and pipeline) in the UK over 28 years, from 1974 to 2002. Units are in million tonnes.
Overall, there was a net increase in the volume of goods conveyed by road, water and pipeline during the period given whereas the volume remained unchanged for rail transport. Road transport was the most popular during the period under review while pipeline was the least favourite.
In 1974, about 70 million tonnes of goods were transported by road. This figure experienced fluctuations over the next 21 years, hitting 80 million tonnes in 1995 and thereafter rising to approximately 100 million tonnes in 2002. likewise transport through water and pipeline experienced almost similar fluctuations from their respective 1974 volumes of about 40 million tonnes and 5 million tonnes, ultimately increasing to about 65 million and 22 million tonnes respectively in the final year.
The quantity of goods transported by rail, on the other hand, did not show a net change over the given period. It started at 40 million tonnes in 1974 and fell slowly to a low of 25 million in 1994 and thereafter rising back to the initial volume of 40 million tonnes in 2002
Hi Liz Kindly Critique me!
Hey ma’am, I was wondering in this graph what would be the overall trend comparison of goods by roads with pipeline or the increase in all three except by rail?
Why do you think you need to choose. An overview needs to be full with all key features. There will often be two key features. What goes up/down and which is higher or lower.
The line graph illustrates the goods transported in the UK by Million tonnes from the year 1974 – 2002.
Overall, majority of the goods that are transported in the UK was done thru driving at the roads. Second most used mode of transportation was thru the ocean and seas, followed by railways and lastly was thru pipelines.
Almost 70 million tonnes of goods are moved throughout the UK using roads in 1974 and the trend rose another 10 million by 1991 and fell down by 5 at 1994 but rose up again reaching the highest at almost 100 million tonnes goods by year 2000. Moving goods by thru the water started at 40 abd had a sharo increase by 1982 which remained constant for 12 years. Moving things by rail started almost same number with water but fell 10% less twice during 1985 and 1994 but rose up from 1995 to 2002.
Lastly, pipeline has the lowest number of all only having thrice less than compared to using the road.
OR
The line graph illustrates the proportion of goods transported by road, water, rail and pipeline in the United Kingdom between 1974 to 2002. Units are measured in million tonnes.
Overall, the preferred mode of transportation of goods in the UK was by road, while pipeline was the least used. Furthermore, there was considerable increase in the utilization of all methods of transit over the given period except for rail which only had a slight increase.
In 1974, about 70million tonnes of goods were transported by road and this figure experienced some fluctuations before reaching a peak of slightly under 100million tonnes in 2002. In contrast, pipeline was the least utilized route, with an attributed figure of about 5million tonnes at the beginning of the given period, followed by a gradual but steady rise until around 1994 where it reached a plateau slightly above 20million tonnes until 2002.
Both water and rail accounted for the movement of goods slightly under 40million tonnes and 40million tonnes respectively. However, the use of water rose higher than rail in 1978 followed by a dramatic increase to more or less 60million tonnes in 1982 before reach a highest point marginally over 60million tonnes in 2002 while rail transport showed several upward and downward slopes before finally peaking at a figure slightly above 40million tonnes.
Thankq dear LIZ madam,your tutorials are really helpful,just one thing i would like to say is to add a bit more of writing task 1 graphs along with their answers…the different types of graphs(more of those complex one and past solved questions on graphs that came in ielts) that could probably come under WT1 along with their answers..it will be really helpful if u do so.
Warm regards,
Harjot singh
Did you see all the model answers for writing task 1 on the main page? There is a model answer for each type of task 1.
Thank you very much Liz!
Hi Liz,
I want to know for the Reading section if i write T/F/NG instead of True/False/Not Given, will the examiner treat it as wrong answer?
It is fine.
Thank u Mam . Good explanation.
appreciate your support
hello mam..I have written more than 200 words in task 1 and more than 450 words in task 2…so will it affect my score negatively ?? ….(However,I have written everything related to the topic)
Yes, it will affect your score. The IELTS essay must be focused and every sentence highly relevant. If you wrote over 450 words than you probably wrote a less focused essay which will lower your score.
Many thanks Liz.
Your emails woke me up and brought me to work back more and more.
As i am working so hard and sonetimes i forget to put my self into elts pratice and focus to reach my goals and use my professional qualification.
You are the Best Ever for IELTS, Love from Baghdad 🙂
Thanks 🙂
Thax u so much mam
Thank you so much dear LIZ!
You’re welcome 🙂
Many thanks dear Liz, I appreciate your efforts. .
You’re welcome 🙂