Pie Chart and Bar Chart for IELTS Writing Task 1

It is possible to be given two charts together in IELTS writing task 1. Below you will see two pie charts followed by a bar chart. This exercise will focus on how to structure your report and how to highlight the key features of both charts in one overview.

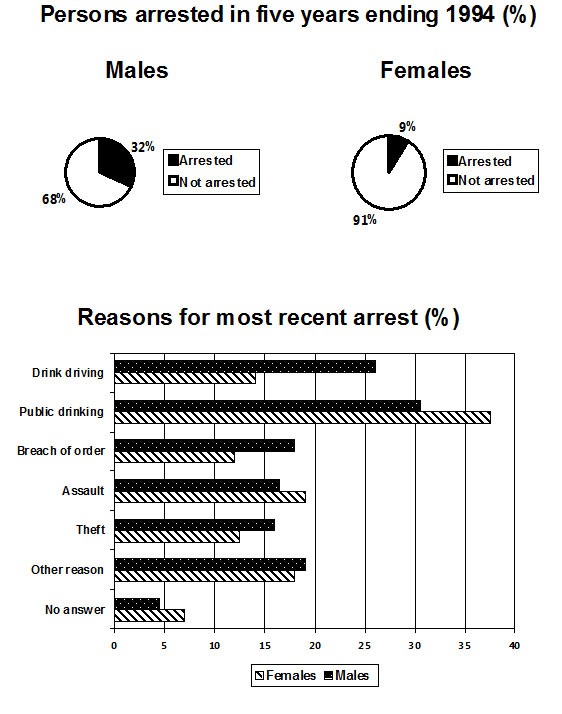
The charts below show the males and females arrested over 5 years and the reasons for the most recent arrests.

two IELTS charts

Source: The above charts were not created by IELTS Liz.

Two Charts: Structure and Overview

Answer the questions below in order to decide your paragraphing for your task 1 report.

  1. Will you put the introduction separately?
  2. Will you have an overview or conclusion?
  3. How many body paragraphs will you have?
  4. What order will you put your paragraphs in?
  5. Will your body paragraphs be equal lengths?
Answers
  1. Yes, the introduction should go in a separate paragraph.
  2. You must have an overview not a conclusion. The overview can go after the introduction.
  3. You should have 4 paragraphs in total.
  4. You should have an introduction, an overview, one body paragraph for the pie chart detail and one body paragraph for the bar chart detail.
  5. The body paragraph with pie chart detail will be shorter than the body paragraph with details about the bar chart


Now write your overview. this paragraph must contain key features from both charts. This means you must write one sentence about the key features of the pie charts and one sentence for the key features of the other chart. After you have written your overview, check the sample overview. Model Overview

Overall, over the five year period finishing in 1994, there were significantly more males arrested than females. The majority of arrests were due to public drinking while no answer was given for the least number of arrests for both genders.


Recommended

Get my free lessons by email

Subscribe for free to get my new IELTS lessons sent to your email inbox.

Introduction and Overview for an IELTS Bar Chart

An introduction and overview for an IELTS chart is given below. The introduction is the easiest paragraph to write and the overview is the most important paragraph in your report. Look at the sample paragraphs below for the IELTS chart given and fill in the gaps. This lesson will help you understand introduction and overview content as well as improve your language skills.

The chart below shows the average monthly expenditure by British households in three years.

ielts chart

Introduction and Overview for an IELTS Chart

Fill in the gaps with no more than two words in order to complete the introduction and overview for the above chart. Remember this is about paraphrasing and ensuring information is stated correctly.

Introduction

The (1) ……………………… illustrates the typical (2)  ……………………….. of money spent each month on utility bills, transport, rent, entertainment (3) …………..groceries by households in Britain in three years (1990, 2000 and 2010). Units are (4) …………………. in pounds sterling.

Overview

(5) …………………., the largest expenditure was on rent,, (6)  ………………. the least amount of money spent was on utility bills and entertainment. While there was a significant (7)  …………………. in spending on rent, transport and utility bills, there was little change in the amount spent on the two other items.

Answers
  1. chart / bar chart
  2. amount
  3. and
  4. measured
  5. Overall (this is the most appropriate linker to use)
  6. whereas / while
    1. it is not possible to use “in comparison to” or any similar linker due to the grammar structure of the sentence. To use “in comparison to” the sentence must read “…the largest expenditure was on rent in comparison to the least amount of money spent which was on …”
  7. increase / rise / growth

Here is an alternative introduction:

The bar chart illustrates how much money households in Britain spent in an average month on utility bills, transport, rent, entertainment and groceries in 1990, 2000 and 2010. Units are measured in pounds sterling.

Tips & Vocab
Paraphrases:

  • shows = illustrates
  • the average monthly = in a typical month
  • expenditure = amount of money spent / how much money was spent

As you can see paraphrases are minimal. Instead of lots of unnecessary paraphrases, alter the structure of the sentence to showcase your language skills. Over paraphrasing can lead to unnecessary errors which can lower your score.

Tips:

  • Either state how many categories there are or list each category in the introduction.
  • Always give dates in the introduction.
  • Give the units if necessary as a final sentence in the introduction.
  • Put key features together in the overview.
  • The overview is usually a separate paragraph which starts with the linking word “Overall”. This helps the examiner locate the overview quickly which is considered a good aspect of report writing.
  • This IELTS chart is considered a simple chart and all students aiming for band score 6 and above should be able to write this report without many errors.
  • See the recommended links below to help you further.

.

Recommended Lessons

Click below to open the link:

…………………………………..

Free Subscribe to get New Posts by Email

IELTS Diagram: Introduction and Overview

For an IELTS diagram, you need an introduction and overall paragraph containing the main features of the diagram or process in your report. The overview is one of the most important parts of your report if you are aiming for band score 6 and above. See below for an example of how to write the introduction and overview for the process shown in the picture.

The InfoVisual.info site uses images to explain objects.

Source: The diagram above was not designed by IELTS Liz.

Introduction and Overview

  • paraphrase the information given about the diagram for the introduction
  • choose the main stages for the overview ( eggs, water, tadpole, land, adult frogs)
Model Introduction and Overview
The diagram illustrates the different stages involved in the life of a frog. Overall, tadpoles, which emerge from eggs in the water, pass through a number of phases before going on to land and maturing into adult frogs.

Recommended Lessons

error: Content is protected !!