This IELTS writing task 1 bar chart (October 2018) was reported and reproduced by an IELTS candidate. It appeared in the IELTS test three days ago. You can download a pdf copy below.
IELTS Writing Task 1 October 2018
Download: IELTS Writing task 1 October 2018
Model Answer
A model answer is now available for this writing task 1.
Click here: MODEL ANSWER FOR TASK ABOVE
All the best
Liz


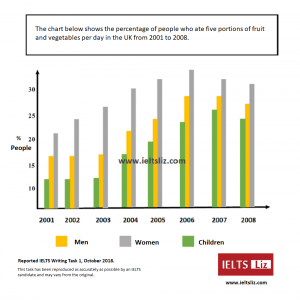
The given chart illustrates the proportion of women, men and children in the United Kingdom, who consumed five portions of fruits and vegetables per day. The data was collected from 2001 to 2008.
It is clearly shown that women consumed the highest portion of fruits and vegetables for the the given time frame. In 2001, they consumed just over 20%, this figure steadily rose that reached its peak in the year 2006, with almost 35%. From this point, it slowly dropped to 30% in the final year.
In terms of men and children, the percentage remained relatively stable. For the first three years men consumption was about 20% while for children was around 12%. Male consumption continue to rise until 2007 that reached its highest , with 28%. Then the figure slightly dropped by 2% in its last year. Meanwhile, children similarly showed the same increasing figures. That reached its highest in the year 2007 with 25% and moderately dropped in the final year.
Based on the information given, women, men and children have shown increasing trend in terms of consuming fruits and vegetables. It is also clear that women are the highest consumer among the other groups.
Hello Dear,
Anyone who wants to practice speaking with me ?
I will take my exam on 17 Nov 2018,
Please send me an email if you want,
Gr.danial@gmail.com
Nice
Yeah I wanna
The chart presents information on men,women and children, who ate five portions of fruit and vegetables per day in the UK from 2001 to 2008.
Overall, the chart shows women dominated the list in terms of using fruit and vegetables in the given period.Then, men clearly ahead of children in terms of consuming the items.
As can be seen, there were constant rise of eating over the year. In 2001, 12% children used fruit and vegetables every day, Consumption raised up to 27% till 2007 and suddenly declined into 24% in 2008. While, men consumed 17% of fruit and vegetables in 2001. Then, increased up to 29% till 2018, the amount casually falls to 27% in 2008. Consuming rate of women were high till 2006 and it was above 30, but decreased in 2007 and 2008, was better than men and children.
the chart contains information on men women and children who consumed five portions of fruit and vegetables per day, in the Uk between 2001-2008.
between 2001-2003, the percentage of men women and children that consumed fruits and vegetables stayed permanent with just over 15% and just over 10%, respectively. throughout the year’s the percentage of women that consumed fruits and vegetables had increased: in 2001, they were just over 20% of women and by 2006 it reached its peak of around 35%.
in 2004, the number of children and men began to rise. and in 2007, reached its peak with 25% and just over 25%, respectively. in 2007 the number of women had begun to decline and reached around 30% in the final year.
The bar chart below shows the percentage of British people (men,women and children) who ate fruits and vegetables per day in a period of seven years from 2001 to 2008.
Generally, for every given year, more women ate fruits and vegetables, followed by the men, and then the children.
The percentage of men and children remained constant for the first three years, while that of the women kept on increasing in a seemingly constant rate. This increment in the percentage of women continued in the subsequent years until it got to its peak at the 5th year (2006), after which the percentage experienced a decline at almost the same rate with which it increased, in the last two years.
Again for the men and the children, after experiencing the constant percentage for the first three years, their percentages in the subsequent years followed the same pattern of increment and decrement as that of the women.
The bar graph illustrates the percentage of people in UK that consume five portions of fruits and vegetables between the year 2001 to 2008.The x axis depicts the percentage values of people in the three different categories male,female and children while y axis shows the relavent years.
overall it can be seen that females were the highest consumers of appropriate amount and fruits and vegetables while males were lagging behind.However the children had shown a much less preference towards healthy food. Fuerthermore there has been a positive trend with rising consuption till the year 2006 but depicted a decline during the following years. Moreover sadly as a whole, less than one third of each category indulged in healthy eating.
In further elaboration in 2001 around 21percent of females consumed adequate fruits and vegetables and it showed a gradual increment to peak toapproximately 35% by 2006. Consequently the values slightly declined to 30 percent by2008.
In comparison to females much lesser percentage of males and children were into healthy eating amounting to around 17% and 12% respectively. Apart from that both categories showed a similar trend with static percentages upto 2003 followed by a steady increase upto 2006 where around 27% males and 24% of kids consumed the recommended amounts.Although there was a slight rise in the percentage of children opting for fruits and vegetables the percentage of males remained the same.Eventualy both these groups showed a slight reduction to end up at one fourth of male population andaround 24% of children obtaining proper nutrition through fruits and vegetables.
The chart below illustrates the percentage of British people (men, women and children) whose daily diet include 5 portions of fruits and vegetables from 2001 to 2008, over a period of 8 years.
Overall, females consumed a higher amount of fruits and vegetables than males and kids. The obvious increase in intake of referred food can be observed among each group of people during the given period.
In the first year (2001), greens and fruits eaten by women accounted for about 25% of the population, followed by men at 16% and kids at only 10%. The figures for latter two remained nearly unchanged in the next three years (from 2001 to 2003), whereas patterns for women increased to over 25% by 2003 and this upward trend continued steadily in the following four years, finally reaching a high at approximately 35% by 2006 before dropping to 30% by 2008. Similarly, greens and fruits also gained increasing popularity among the other two groups ever since 2003. Specifically, both figures from males and kids reached their peaks by 2007, at 27% and 25%, respectively, then they declined in the final year (2008), by less than 2% for each.
On the whole, all groups consumed a significant higher quantity of fruits and vegetables over this 8 years. Though women always stood at the top, in terms of healthy food mentioned, men and kids managed to reduce the difference in consumption.
The bar graph illustrates the percentage of people in the UK that consumes five portions of fruit and vegetables, daily from 2001 to 2008.
Overall, it is clearly seen that women consumed more fruit and vegetables in the given period compared to men and children. Also, the consumption for women peaked in year 2006, while men and children maintained a steady consumption trend from years 2001 to 2004 but increased from 2005.
Furthermore, there is a marginal increase of about 3% in the consumption pattern of men from 2004 to 2006, which remained constant at 28% in 2006 to 2007 but declined by 3% in 2008. Similarly, the consumption pattern for the children showed the same trend but stood at 25% in 2007, while a decline of about 2% is seen in 2008.
However, the women’s consumption maintained a steady growth of about 3% year on year for seven years (2001 to 2006), unlike those of men and children.
There is a significant drop of approximately 2% in the consumption pattern of everyone in 2008 compared to other years.
The chart below gives information about the proportion of people who ate fruits and vegetables in a day, in the UK, over a seven year period from 2001 to 2008.
Overall, it can be seen that women had the highest percentage of people who ate fruits and vegetables, in contrast to that of children which is the least.
The proportion of women who ate fruits and vegetables initially stood at just over a fifth in 2001, which is the highest compared to that of men and children. This is then followed by a gradual rise over the years, and then peaked at over 30% in 2006 which remained the highest among the three.
2001 to 2003 witnessed no change in the proportion of men and children who ate fruits and vegetables with the percentage being higher for men at over 15%. Whereas, that of children stood at over 10%. Both experienced a steady increase through the years, however,lower than that of women. This then preceded by a peak at about 27% in the year 2006 and 2007. However, that of children reached the highest point at 26% in 2007.
2018 experienced a slight decline in the consumption of fruits and vegetables by all of them all, with the percentage of women still maintaining the lead at just a third, while that in children at under a quarter.
Dear Liz
Your videos were a great help for preparing for IELTS exam.
I cleared with an overall score of 8.
Keep up the good work. Thanks.
That’s great – well done 🙂
The chart illustrates the proportion of individuals (men, women and children) who consumes five portions of fruits and vegetables daily in the UK over a period of 7 years from 2001 to 2008.
Overall, the percentage of women in the UK that consumes five portions of fruits and vegetables daily is greater than the percentage of both men and children. However, British children have the lowest percentage of daily consumption of five portions of fruits and vegetables in the given period.
The percentage number of British women steadily increase from slightly above 20% in 2001 to far above 30% in 2006 and gradually decrease to slightly below 30% in 2007 and 2008. However, the percentage of children who consumes five portions of fruits and vegetables daily remain constant at slightly above 10% from 2001 to 2003 and then increase gradually to exactly 25% in 2007 before dropping to slightly below 25% in 2008.
Moreso, the percentage number of British men is greater than the percentage of children but lesser than that of women. Slightly above 25% of men in the UK consumes more fruits and vegetables daily in 2006 and 2007 but in 2008, the percentage dropped to exactly 25%.
The chart illustrates the proportion of men, women and children in percentages who consume five portions of fruit and vegetables each day in the UK over a period of 7 years( from 2001 to 2008).
Overall, the percentage of women who consume fruits and vegetables daily in the UK was the greatest, following by that of men while children are the lease.
Over the years, the consumption of fruit and vegetables amongst women has progressively increased from 2001 with a percentage of 22%. It peaked in 2006 and later declined slightly in 2007and 2008 respectively.
It is obvious from the chart, that the percentages of men and children who ate fruit and vegetables daily remained constant at 12% and 17% in the first three years (2001, 2002 and 2003). After which, it slightly increased, reached its peak in 2006 at 18% and 28% respectively then it equally declined in the later years.
The given bar chart provides information on the rate of men, women and children in the UK,who ate a variety of fruits and vegetables daily over a period of 8 years.
Overall, the women indulged in this lifestyle more frequently during this period. The men and children started out lower but gained increasing popularity over time, with the children recording the least frequency amongst the 3 categories.
Initially, the women recorded just a little above 20% in 2001,this rose steadily annually, reaching it’s highest point of above 30% in 2006 before decreasing to about 25% in 2008. The men started out at about 15% in 2001, and remained thesame over the next 2 years , followed by a sharp increase per year to just above 25% in 2006 and 2007 before experiencing a decrease in 2008.
This habit was least popular amongst the children, plateauing at just above 10% for three consecutive years. This was followed by an upward trend annually, hitting its highest and lowest rate in 2007 and 2008 consecutively.
The bar chart represents the proportion of British men, women, and children who consumed five portions of fruit and vegetables daily from the years 2001 to 2008.
Overall, women has been the highest consumer of fruit and vegetables while the least portion was consumed mainly by children. It can also be noted that men, women, and children had an upward and downward trend over the given period.
Getting back to the details, in 2001, women’s rate of eating fruit and vegetable started to just over 20%. This significantly increased in the following years, having the highest amount of fruit and greens intake to almost around 35% in the year 2006. But this gradually dropped to almost 5% during the final year in 2008.
Meanwhile, there has been a plateau between men and children’s consumption of fruit and vegetable and this was during the first three years, from 2001 up to 2003. Children accounted to just around 12% in those three years while men had roughly around 17%.They both had a gradual improvement in the succeeding years that in 2006 and 2007, men had their maximum amount of edibles to nearly 28%, whereas children had 25%. Both group also had a minimal decrease of nearly 1% in 2008.
The bar chart gives information about the proportion of men, women and children who consumed five portions of fruits and vegetables in the UK over a period of eight years (2001 to 2008)
Overall, the percentage of men, women and children who are the five portions of fruits and vegetables have all increased. Again, British women consumed more fruits and vegetables compared to men and children.
In terms of consumption by men which stood at approximately 17% in 2001, remained constant from 2001 to 2003. In 2004, it increased sharply to about 21%, reaching a peak of almost 27% between 2006 and 2007. By 2008, it had fallen slightly to more or less 26%. In the same way, consumption by children was also stable from 2004 to 2006. It showed an upward trend from 2004 to 2006 and boomed at 26% in 2007. In 2008, it declined minimally to almost a quarter.
In terms of fruits and vegetables eaten by woman which registered the highest of more than a quarter, increased steadily from 2002 to 2005, reaching a high of more than a third in 2006. Between 2007 and 2008, it had almost levelled out.
The chart describes the fruits and vegetables consumption by percentage of people per day from 201 to 208 in UK.
The chart shows that the consumption of vegetables and fruits by children is constant for first three years from 2001 to 2003 and then gradually increase to about 25% from 12% and then decreases to about 24% in 2008. The fruits and vegetables consumption by men follows the same trend with higher percentage of people except it is constant in 2006 and 2007 to about more then 25%. the consumption trend is different for women, it is gradually increasing from around 22% in 2001 to more than 30% in 2006 and then decreases to around 30% in 200.
The graph also exhibits that the percentage consumption by women is always more more than the others category of people and least consumption is by the children throughout the period. It is also inferred from the graph that the consumption are very similar for men and children.
The bar charts illustrate the percentage of men, women and children of the UK from the year 2001 to 2008, who ate five parts of the fruits and vegetables. The number of people is given in percentage.
For each year the number of women who consumed five portions of the food were more than the number of men and children, while the least of the number of children accounted, who ate this food.
The proportion of women reaches its peak value 37% in the year 2006 , while least 22% in the year 2001. The number of women was increasing from 2001 to 2006 (22% to 37%) and decreased for the years 2007 and 2008, to 28% and 30% respectively.
In comparison to the number of women which was increasing right from the beginning, the number of children and men was constant from 2001 to 2003, which was 16% and 18 % respectively. After that the number of children and men increases. The number of children reached its highest value of 27% in the year 2007 and that of men to 28% in the year 2006. While the number of children decreases for 2007 and 2008 and that of men remain constant for 2007 and decreases to 29% for the year 2008.
The given bar chart illustrates the percentages of individuals who consumed five portions of fruits and vegetables on daily basis. The survey was conducted in the Great Britain over a period of seven years.
Overall, the female ranked to be the highest in consumption of organic food, followed by male members.
The ladies showed an increasing trend over the first 5 years, rising from a quarter approximately to over 30% in the year 2006. However, men showed a stagnant pattern over the first three years, but rose gradually and almost doubled there food consumption in the year 2006. Similarly, children reflect a similar pattern to the male members, by displaying a steady pattern initially and progressing in the upcoming years. By 2007, the healthy food eaten by youngsters was almost a quarter, which was approximately three folds greater than the fiber-rich diet consumed by them during the initial three year period.
The given chart provides information about the variations in the category of people. They consumed five types of fruit and vegetables per day in the United Kingdom between 2001 and 2008. The units is in percentages.
Overall,the women recorded the highest percentage of people while the children had the lowest record over the years. Although the three categories of people had some fluctuations yet the women maintained their leading growth over the years.
It is indicated from the chart that the women began with around 20 percent of the population. It reached her peak in 2006 with around 38 percent then,experienced a decline in the last two years. In contrast,the children had a record of about 13 percent in the first three years. However, it increased gradually to around 25 percent in 2007 then declined in 2008 to 21 percent.
Meanwhile, the men recorded about 18 percent which was steady in 2002 but increased slightly in 2003.However,in 2004,it increased progressively with 4 percent and achieved around 28 percent in 2006.Unfortunately, it declined in the last two years.
Hi Liz,
Does the bar chart related task appear in general training exam?
As I am appearing for the general training ielts exam in December 2018,do I need to study the bar chart as well? or only letter writing?
Thanks in advance.
See this page: https://ieltsliz.com/ielts-gt-academic-writing-differences/
The Bar Chart above demonstrates the percentages of consumption of vegetables and fruits more than 5 times in a day subgrouped people by women, children, men on the Y axis, according to years between 2001-2008 on the X-axis.
If we just look 2001 and 2008 we can say there is big difference in consumption. Although it seems linear graphic at first glance, fluctuations need to be considered for absolute recognition of the columns. It might be hard to differentiate behaviors subgroup vice by just overlook so that we need to examine a little bit detail.
Let’s go detail for all 3 type, First of all we see that whatever the year is Women always comes first, men are second and the children last. Children for 3 years kept their level, then constantly upgraded their percentage until 2008 but around 2007 and 2008 we see a breaking point to downward, Men have almost the same data with children but Women data show the breaking point was in 2006 after getting up year by year.
We can conclude that people eat more vegetables and fruits than in 2001.
Thnx a lot for both question and varied answers
The bar chart illustrates the percentages of people(women,men,children)in UK who consumed five portions of vegetables and fruits per day over the period of seven years,from 2001 to 2008
It is evident that in 2001,women were the leading consumers of fruits and vegetables per day,amounting 21 percent followed by men and children who ate 17 and 12 percent respectively.
Over the years consumption of fruits and vegetables by women increased progresssively till 2006 where their part is 33 percent.After that it showed slight decline and came down to 30 percent in 2008.
Consumption of edibles by men and children remained steady from 2001 to 2003 and then increased steadily and peaked in 2007 to 27 percent and 25 percent respectively and tgen showed small declime in the following year.
To sum up,women remained the main consumers of fruits and vegetables per day followed by men and children in descending order.
The chart demonstrates the percentage of men, women and children who ate five different types of fruit and vegetables per day in United Kingdom during eight consecutive years from 2001-2008.
According to the graph, children consumed nearly 12 percent in 2001 and 2002 which remains a plateau. It shows an upward tendency by the following years and reached the maximum and highest amount in 2007.
Moreover, approximately 17 percent of men ate fruit and vegetables from 2001 to 2003. Here, the quantity is steady. Not only this also these people consumed the largest amount in 2006 and 2007.
Generally speaking, there were many women who had more than 30 percent of these food in 2006. It is roughly 10 percent higher than 2001.
In conclusion, the ratio of men, women and children represented in the graph show a rapid raise of consumption during the whole eight years in UK.
The chart below illustrates the percentage of Women Men and Children who consumed five pieces of fruits and vegetables every day from 2001 to 2008 in the UK.
Overall, the british women consumed the highest amount of fruits and vegetables than the men and children within the given period.Both the Brirish women and men consumed the most percentage of fruits and vegetables whereas the least portion were consumed by the children. Furthermore the most significance difference between the british male and children was in 2003.
In terms of fruits and vegetables eaten by the british women, most of the women consumed over 30% in 2006,in 2001 the percentage of fruits and vegetables consumed was about 20% which was the least ,then it rose steadily to almost 25% in 2002, over 25% in 2003, 30% in 2004 until it reached it’s peak in 2006.After which it dropped steadily from 2007till 2008.
In the men, the portion of fruits and vegetables consumed in 2001 was about 15% which was the least percentage, and remained constant till 2003, after which it increased to about 20 % in 2004 and rose steadily till 2006 when it reached it’s peak of over 25% and remained constant in 2007, then in 2008 there was a slight decrease to about 25%.
The percentage of children who ate portions of fruits and vegetables in the UK were just over 10% and it remained constant from 2001 till 2003, in 2004 it increased slightly over 20%, then it rose to well over 25% in 2007 reaching it’s peak, and it decreased to 25% in 2008.
The given bar graph illustrates the percentage of men, women, and children in the UK who ate five portions of vegetables and fruits each day over a period of eight years(2001-2008). Overall, women were the highest consumers followed by children and men respectively.
In 2001, a little over 20% of women ate five portions of fruits and vegetables while about 17% of children and nearly 13% of men did so. By 2006, these figures rose steadily as the way more than 30% women, nearly 29% of children and about 24% of men consumed five portions of fruits and vegetables. However, the percentages then dropped again slightly and in 2008, still, a little more than 30% women, about 26% of children and a little under 25% of men consumed the five portions of fruits and vegetables.
The percentage of women rose steadily from over 20% in 2001, peaking at more than 30% in 2006 but then dropped slowly to about 30% in 2008. In contrast, the numbers were stable from 2001 until 2003 for both men and children (about13% and 17% respectively) but then rose steadily until 2006 but then they too showed a steady decline until 2008.
The bar graph emphasis the rising percentages of the population in the UK consuming five portions of fruits and vegetables over the given period though the trends started to show a decline by 2008.
Do send me your inputs. My exam is on 3rd Nov.
Commendable
The bar chart gives information in percentage wise the categories of people( men, women and children) who consumed five sections of fruit and vegetables daily in United Kingdom from the years 2001 to 2018.
Overall, it is clearly seen the consumption of these edibles are significantly inclined to women as compared with males and the younger people.
To begin with, from the early three years of the period, the rate at which both men and children ate different portion of fruits and veggies remained constant, that was 17% and 12% respectively. But during those periods, the ratio of women rose from 23% to 26%. And after those years, eating of fruits and vegetables become popular with both men and children.
From 2004 to 2006, there was an increment with the number of young people and men and that accounted for 23% and 28% precisely. In 2006, more than 30% of women was recorded to have eaten different parts of fruits and veggies and that was the highest of the consumption.
In 2007, the number of children rose to 25% as the ratio with men remained the same. And also in the last two years (2007 to 2008), women who ate different parts of edibles decreased slightly below 30%. Similarly, it was only in 2008 that men and young people had a meager decrease and that was recorded as 26% with men and 24% with children.
The chart illustrates the five portions of fruits and vegetables consumed per day by British people over a period of eight years from 2001 to 2008.
Overall, eating habits of British people for fruits and vegetables increased over a period of eight years. Main consumers of fruits and vegetables in British in 2008 were women. They were around one-third of the total population of British. This figure was followed by men which stood at around twenty-eight percentage of the total population of Britain. Children were least in term of numbers for the consumption of fruits and vegetables in 2008.
In addition, there was a certain population of children and men which was constant for the first three years (2001-2003) for the consumption of fruits and vegetables. The figures for children and men stood at twelve percent and seventeen percent of the total population respectively from 2001 to 2003. Then after these figures increased to twenty-five percent and twenty-eight percent in 2007 before decreased to 26% and 25% respectively in 2008. Similarly, women population for the consumption of fruits and vegetable raised to around 34% of total population in 2006 from just above 21% in 2001. However, it started to fall then after and went down to 29% in 2008.
In conclusion, the population of children, men and women for the consumption of fruits and vegetables have been increasing over a period of eight years.
The bar chart illustrates the percentages of men,women and children who consumed the five daily portions of fruits and vegetables in the UK between 2001 and 2008.
Overall, the consumption of the five portions among the three categories took an increasing trend over the eight years.In addition, the percentage of women was greater than the percentages of men and children.
Concerning women, the percentage of women was 22% in 2001 , then continued to increase during the following years ,from 2002 to 2004 it was between 25%and 30% . In 2005 the percentage exceeded 30% until reaching its peak in 2006 With 39%, in the next two years the fraction decreased to 30% and 28% in the years 2007 and 2008 respectively .
looking at the percentages of men and children who ate the five potions of fruits and vegetables , it was stable for the first three years from 2001 to 2003 at 17%and 12% for men and children respectively . In 2004 the figures jumped to 17%for children and 21% for men.The percentage of men rose in 2005 to be 24% , then reached its peak in 2006 and 2007 with a percentage of 28% before it fell again in 2008 where it was 22%.While for children the percentage increased from the year 2004 where its peak was in 2007 it was 26%, then decreased again to 24% in 2008.
Thank you
The chart illustrates the proportion of men, women and children that consumed five parts of fruits and vegetables each day in the UK from a time period of 2001 to 2008
Overall, it is clear that rate of consumption of fruits and vegetables had an upward trend in each category of people with children having the lowest and women having the highest consumption rates throughout the period.
The proportion of children started a little above 10% in 2001, maintaining that range through to 2007 with about 17%, 19%, 22% and 25% respectively. It finally ended the period with about 22% in 2008.
The rate of men that ate fruits and vegetables had almost similar trend with the children, beginning the period in 2001 with about 17% through to 2003 before making a steady increase from 2004 to 2007 with about 22%, 24%, 28% respectively. It declined a bit just below 30% in 2008.
2²% of women consumed fruits and vegetables in 2001. It maintained an uprise trend throughout the period with about 24% in 2002. 26%, 29% and 30% respectively in 2003, 2004 and 2005 respectively before reaching its peak in 2006 at a value greater than 30% and ending the period with about 31% and 30% respectively in 2007 and 2008
The bar graph beneath, illustrates how some number of British consumed vegetables and fruits daily over a 7 year period, (2001 to 2008) in five portions.
The diagram depicts the proportion of population who ate five different kinds of fruits and vegetables per day in the British from 2001 to 2008 .
It is clear that women were having fruits and vegetables in higher percentage among three of the group, each year where as children were having less.Men were having medium compare to women and children.
By the 2001 to 2003 there was same level of proportion of men who ate vegetables and fruits that is above one 5th similarly children were also in constant level of below one 5th. But there was slowly increase in the proportion of women (by 5th to a quarter). Then from the year 2004 to 2006 there was increment in all three people (children: 17% to 22%; Men: 20%-26% approximately and women 30% and above. But in 2007 and 2008 there was decreased rate of women (below 30%) where as there was steady position of men and children.
The chart demonstrate the ratio of portions which had consumed by the people in the UK between the years 2001 and 2008 per a day.
Overall, the women had consumed of protions more than men and children
The bar chart illustrates the proportion of men, women and children who consumed five portions of fruit and vegetables per day in the United Kingdom over a seven-year period from 2001 to 2008.
Overall, women accounted for the majority of consumers, while children ate the least fruit and greens. Moreover, all three categories saw a peak which occurred in 2006 for adults and 2007 for children.
The figure for women started at just over 20 percent and steadily rose up to about 35 percent by 2006. It then saw a slight fall reducing its value by about 5 percent in the last two years considered.
On the other hand, the percentage of men and children remained constant over the first three years considered. They then begun a stable upward trend peaking to their highest levels (well over one in four in 2006 and one quarter in 2007 respectively). In the last years, similarly to what happened for women, the proportion of men and children slightly decreased, ending the period at a few points lower than the highest for their categories.