Learn how to organising information into logical paragraphs for IELTS Writing Task 1. Deciding which categories go into which paragraphs is crucial for a high score. Below is a practice lesson with a bar chart typical of IELTS Writing Task 1 to show you how to do this. Bar charts are common in IELTS writing task 1 academic paper.
How to Organise Information – IELTS Writing Task 1
Coherence and Cohesion, which is 25% of your marks. This marking criterion is about:
- logical order of information using paragraphs
- logical order of information inside paragraphs
- linking words
This is one area of that people often forget which greatly impacts their score. So, you must spend time during your planning stage to think about how you plan to organise data. You can read more about the marking on this page: IELTS WRITING TASK 1 MARKING CRITERIA WITH TIPS.
Some people find it difficult to decide which categories and what data should go into what paragraphs, particularly if there is a lot of information given in the task. Remember, writing task 1 is not an essay, it is a report which needs to be concise and highly organised.
Check your organisation skills
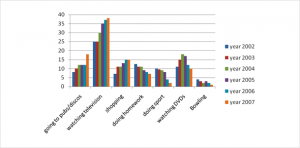
The bar chart below shows the hours per week that teenagers spend doing certain activities in Chester from 2002 to 2007.
Source of Bar Chart: https://www.english-in-chester.co.uk
QUESTIONS FOR YOU
- How many paragraphs would you have?
- How would you organise the categories into body paragraphs? Which categories go into which body paragraphs?
ANSWERS
The answer to this lesson is now available.
CLICK HERE FOR ANSWERS: Answers to bar chart organisation
All the best
Liz
RECOMMENDED FOR YOU
- How to prepare for Writing Task 1
- IELTS Bar Char Model Answer
- IELTS Table Model Answer
- ALL MODEL ANSWERS & TIPS FOR WRITING TASK 1
.


I will have four paragraphs
paragraph one is introduction(i will rewrite questions and overview)
paragraph 2 i will talk about the highest features
paragraph 3 i will talk about the lowest features
Paragragh 4 is summary
The bar chart compares the hours spent on activities such as going to pubs/discos, watching TV, shopping, doing homework, doing sport, watching DVDs and bowling.
The data clearly shows watching TV has been the most favourite activity whereas bowling shows to be the least favorite in the whole period of survey.
Almost 25 to more than 35 hours were spent on watching TV from 2002 to 2007 in comparison to other activities where the hours spent per week is almost had of that spent on watching TV.
Time spent on bowling from 2002 to 2007 was less than 5 hours per week.
Apart from these, activities like watching DVDs shows approximately 15 hours per week of engagement in the year 2004 & 2005, going to pubs and discos shows a little over 15 hours spent per week.
All other acitivities show less than 15 hours spent per week during the survey period.
hi Liz , the answers:
1- 4 paragraphs.(introduction, overview, Body paragraph 1,and body paragraph 2.
2-In Body paragraph 1 (mention the highest and the lowest, in details, and compare.)
3-In Body paragraph 2 (mention the equal, and the significant difference,)
1st para: Introduction + overview.
Body para 1: facts about indoor activities.
Body para 2: facts about outdoor activities.
Hi Liz,
The first paragraph will include the introduction and the overview. The second body paragraph will include information about the activities that have increasing trend for the given period ( watching TV, going to public and shopping). The third paragraph will be about the activities for which the interest have declined (doing homework, bowling, DVD, and doing sport.
Dear Liz,
There will be five paragraphs.
1. Paraphrase the question, this is the bar charts showing the change during a certain period.
2. Overall main feature
3. Discuss detail for the increasing trend groups
4. Discuss detail the decreasing trend groups
5. Discuss detail the bell shape groups.
Hi Liz…
1. Introduction
2. body paragragh 1
3. body paragraph 2
4. conclusion
I would would have 5 paragraph.
P1 Introduction : paraphrase the information given by ielts.
P2 Overview : selecting the highest and the least features over the period and also any other significant changes
P3 those activities with increasing trends watching TV, going to pub/ disco then shopping.
P4 those activities with decreasing trend doing homework and doing sports.
P5 those that flatuates watching DVDS and bowling.
I will begin with the introduction and general overview statement in the first paragraph.
Second paragraph i will describe with figures the hour trends which increased over that given period i.e Tv, pubs and shopping.
Third paragraph those that decreased in hours over that period i.e homework abd sports
Lastly about fluctuated dvds and the least bowling.
But am afraid my words will be far more than 150. Please advice
1. I will have 5paragraphs( introduction, overview + 3 body paragraphs.
2. Organization of paragraphs
1st body paragraph will write about the categories for going to pubs and watching television and watching DVDs .
2nd body paragraph :shopping ,doing homework and doing sports
3rd: Bowling.
5 paragraphs. parag. 1 Introduction, parag 2 overview, parag 3 increasing trend(going to pop,watching tv, shipping ), parag4 decreasing trend parag 5 fluctuating trend.
5 paragraphs
1- introduction
2- overview
3- sport & bowling disco “outdoor stuff”
4- tv, dvd
5- homework
Forr paragraphs
1-introduction
2. overview
3.Body paragraph 1(those activities that has overall increase with the years-Going to pob,watching television and shopping
4 Body paragraph 2( those activities with overall decrease over the period-Doing homework ,doing sports,watching DVD and bowling
1, I would have 8 paragraphs.
2,I would organise the work into;
-Introduction.
-Body of the article,which will have the hours spent in various activities in different years.This part will form paragraph 2- 7.
-Summary.
Paragraph 1- Intriduction.
Paragraph 2- Time spent on various activities in a week for the year of 2002
Paragraph 3- events of 2003.
Paragraph 4- Activities of the week and time for the year of 2004.
Paragraph 5- Events of 2005.
Paragraph 6- This paragraph will contain data of 2006.
Paragraph 7- Here will have the stuff of 2007.
Paragraph 8- This one will have the summary.
Hi Liz.
This will be my introduction..
The bar chart illustrates how the teenagers in Chester have spent their time weekly on the seven activities listed over a period of six years..
Hi Liz ..
This will be my introduction…
The bar chart illustrates how the teenagers in Chester have spent their time weekly on the seven activities listed , over a period of six years.
Of course my report will have introduction and overview.
The body paragraph will look as follow:
BP1: Pubs + TVS for similar trend and Shopping + DVD as DVD topples shopping in the middle of the period before falling again to lower share than shopping
BP2: Other three will be grouped as the interest in them remained lowest and displayed continuous detriment in time spent . ( HOMEWORK, SPORTS and BOWLING)
Hi Liz
My introduction will be:
The bar chart illustrates how the teenagers in Chester have spent their time weekly on the seven activities listed over a period of six years.
I would write the report as follow:
1. Introduction
2. Overview
3. Body Paragraph 1 : Grouping Pubs and TV for similar trend of continuous increase and Grouping Shopping and DVD as DVD topples shopping in middle of the period before being dominated by Shopping again
4. Body Paragraph 2 : Homework and sports for similar trend and bowling for remaining lowest throughout the period
This is my first comment of here on this website . I am extremely thankful to Liz for the great charity she is doing by providing this mammoth pool of knowledge. Hopefully this website will engender a growth of in my English writing skills.
Thank you
I would have the following paragraphs; I will have 3 body paragraphs.
1. Introduction
2. Body paragraph-1
3. Body paragraph-2
4. Body paragraph-3
5. Conclusion
The give bar chart illustrates the amount of hours that young people in Chester weekly spent on doing different activities, between 2002 to 2007.
Overall, watching television was the most popular hobby in all the mentioned years, while bowling was the least one. Although Going to pubs, discos and shopping gradually gained more popularity over the years, spending time on doing homework, sport increased. In addition The hours spent on Watching DVDs fluctuated over the years.
Watching television popularity rose from 25 hours per week in 2002 to more than 35 hours in 2007, this figure was the highest hours that teenagers spent on one activity. Those young people went pubs and clubs approximately 8 hours per week, and incresed this time by 10 hours in 2007. Shopping hobby were the forth common activity amid teenagers, reached 15 hours per week in 2006 and 2007. There were a sharp decrease in homework and sport hours , peak the lowest point at nearly 8 and 3 hours respectively , in 2007. Eventhough By 2004,hours for watching TV had rose to a peak of roughly 17 hours, it depicted a sharp fall to just 10 hours in 2007. During the five_year period shown teenagers constantly spent less than 5 hours on bowling.
Hi. We Will write the information in 4 paras.
First will be introduction ie paraphrasing the topic .
Second will be the overview, showing most prominent info,like highest or lowest or consistent trends ,throught the given years.
Then,body paragraph 1 ,showing info with percentages for first 3 or 4 activities.
Body paragraph 2, containing info about rest of the activities (prominent changes)
Four paragraphs:
1) I will paraphrase the sentence given and that would be my introduction : “The bar chart illustrates particular tasks that were undertaken by youths in Chester, and the duration of each of these tasks was outlined in hours during a week for the period between 2002 and 2007.
2) Overall – Just giving all 7 activities and saying about the one with highest number of hours (watching TV) and least hours (bowling).
3) Body paragraph A – Probably I will compare whatching TV and whatching DVDs which had longest hours for 2003, 2004 and 2005. After that I will talk about going to pubs and discos combined with shopping as they were similar at the beginning and increased over the years given.
4)Body paragraph B – There will be the other three activities (doing homework, doing sports and bowling) as the teenagers were less interested in them which decreased their hours from the first year until the last one.
Four paragraphs:
1) I will paraphrase the sentence given and that would be my introduction : “The bar chart illustrates particular tasks that were undertaken by youths in Chester, and the duration of each of these tasks was outlined in hours during a week for the period between 2002 and 2007.
2) Overall – Just giving all 7 activities and saying about the one with highest number of hours (watching TV) and least hours (bowling).
3) Body paragraph A – Probably I will compare whatching TV and whatching DVDs which had longest hours for 2003, 2004 and 2005. After that I will talk about going to pubs and discos combined with shopping as they were similar at the beginning and increased over the years given.
4)Body paragraph B – There will be the other three activities (doing homework, doing sports and bowling) as the teenagers became less interested in them which decreased their number of hours from the first year to the last one.
Hie Liz,l would write 9 paragraphs,that is :the introduction,overview then each year would contain its paragraph.
1. Paraphrasing
2. Overview
3. Incresing trends : going to pubs / discos, watching TV, shopping
4. Decreasing trends : doing homework, doing sport, bowling
5. Fluctuating trend : watching DVD´s
Hii liz
There would be total 4 para in writing task 1
Including introduction and overview of chart
Then para 1 could be a camparison between highest and decreasing trend
Para2 about least variations among rest of data..
And final part include conclusion which contains most striking feature of the bar chart not our own view….
total 4 paragraphs
Intro
overall and
body paragraph 1and 2
To organize in para 1 the activity which they have done mostly and the same trend following activities are included.
While in para 2 least done activity and same trend following activities will be included.
Four paragraphs…
First- Introduction and overview talking about the increased number of hours spend in watching television and watching dvds however physical activities such as sports reversed over the years and bowling was at its least preferred list in teenagers in Chester.
Second- first body paragraph will compare the number of hours spend on television and dvd.
Third- second body paragraph will talk about the leisure activities such as shopping,pub and the number of hours spend for their educational purposes.
Fourth- third body paragraph will explain the decrease in physical activities such as sports and bowling.
1. Introduction
2.Overall
3.The highest and lowest activities during those 6 years
4. Shortly about the rest activities
4 paragraphs together
Hi Liz, I’m going to write down four paragraphs:
1) Introduction
2) Overview
3) Body 1
4) Body 2 ( I decided to make the bodies 2, so as to be able to analyse all the information in details since the information looks many)
Respected Madam,
The report can be completed by 4 paragraphs
1. Introduction+Overview
2. Body1: The highest spending bar
3.Body 2: Rest of the bars
4. Conclusion
Very simply it can be discussed if you help. Waiting for your full answer,
Madam, Would you please give 5 or 6 category of task 1and 2 with answer so that we can practice more before exam?
first part regarding intoduction about the topic.
second part- the most significant activities carried out by the teenagers from the year given in chart and then regarding least performed activities by them.
Then in third paragraph , constant actvities performed by the teenagers.
last part the conclusion and our own opinion regarding the chart.
Hi, IELTS Liz,
I would write 4 paragraphs
1.Introduction
2.Overview
3.Body Paragraph 1: compare in 2002 which activity was the most favorites choices
4.Body Paragraph 2: compare which was the most favorite among different activities and how it was changed throughout 6 years.
Hi Liz, first of all, this lesson really helpful. Thank you so much.
1. there are 3 paragraphs, introduction, body p1 and body p2.there is no conclusion in writing task 1.
2. I will write an overview, then describe the highest and lowest and compare the similarities in body p1. the rest of activities in body p2, including any static increase or decrease of activity between years.
1. I will have 3 paragraph. Introduction, overview, and body paragraph.
2. Data will be categorized based on activities. I am going to choose data activities per hours per week for each categories in the first period 2002 and the end period 2007.
There would be 4 paragraphs
1. Introduction
2. Body paragraph 1(which covers the first 3 categories)
3. Body paragraph 2( and it covers the last 4 )
4. Conclusion
1. I would have 3 paragraphs; introduction, main body, and conclusion.
2.
3 categories that are going to pubs/discos, watching television and shopping are increasing every year.
3 categories that are doing homework, doing sports and watching DVDs are decreasing every year.
The bowling is the lowest hours constantly.
Charts representing different activities engaged in by teenagers per in hours per week from year 2002-2007.Acvities ranging from watching, television, shopping, doing home work, watching DVDs bowling, doing sports and going to pubs/discos. From the graph there was a steady increase in the numbers of hours spent per week on watching television which rose from 25hours in 2003 to 35hours in 2007,while there was a decline in the numbers of hours per week spent in doing home work which dropped from 10 to 7hours per week.
Also the number of hours per week spent in doing sports dropped from 10hours per week to less than 5hours from year 2002-2007.A steady increase was observed in the hours spent on going to pubs/discos and shopping,even though the hours was static between 2004-2006 for pubs/discos and 2003-2004 for shopping.Watching DVDs experience rise in the number of hours up till 2004 when decline set in. Bowling was the least of all,had less than 5 hours in all per week for all the years.
In conclusion teenagers spend more hours on watching television than all other activities. 3paragraphs
I will write 4 paragraphs
1- introduction
2-overview
3-activity with the most hours spent vs activity with the least ours spent.
4-activities with increasing time spent vs activities with reducing number of hours spent between 2002 and 2007.
Answer
The bar chart illustrates the amount of hours that teenagers in Chester spent on a number of activities per week between 2002 and 2007.
Overall, the teenagers spent most of their time watching television while they devoted the least of their time on bowling. While the number of hours spent on activities such as watching TV, going to disco houses and shopping increased, the amount spent on homework, sporting activities and bowling reduced over the years.
The adolescents in Cochester spent most of their time in front of the TV and used the least on bowling. The number of hours devoted to TV ranged from 25hours in 2002 to about 37 hours in 2007. On the other hand, the amount of time spent on bowling was generally less than 5 hours throughout the whole period.
The number of hours used in pub houses, watching TV and shopping increased between 2002 and 2007 while those on activities like homework, sporting and bowling reduced over the years. For example, the length of time spent shopping in 2002 was about 7 hours, which then saw a relatively steady rise until it reaches 15 hours at the end of the year 2007. In contrast, the amount of time spent per week on sports was about 10 hours in 2002 which the declined over time, reaching just about 2 hours at the end of the time period
The bar graph give information on amount of time spent in hours per week by teenagers doing 7 activities in chester between 2002 and 2007. Overall , it obvious that most popular activity among teenagers was watching television. while most unpopular activity was bowling.
Watching television was very popular among youth as over the period of 6 years it increased from 25 in 2002 to around 35 in 2007. Another activity that was enjoyed by teenagers was watching DVDS as they spent more than 10 hours per week in all years.
At the beginning activities such as going to pub and shopping were unpopular but at the end their popularity increased, While activities like home work and sport recorded a decrease on time spent on them .Most teenagers spent least time on bowling.
I’ll have for paragraphs.
The first paragraph will paraphrase the topic
The second will give an overview view discussing the highest and lowest hours of activity in a particular year.
The third will discuss all the high numbers of hours and the fourth which will be my conclusion will discuss the low numbers of hours.
For this task< i would divide my response in 3 paragraphs followed by a conclusion paragraph.
Paragraph 1. Paraphrasing and brief introduction of information
Paragraph 2. Major trends like watching TV, going to disco/pubs and DVD
paragraph 3. Minor trends bowling, home work
Paragraph 4. Conclusion
According to me, I prefer 4 paragraph
Introduction
Body paragraph 1- overview
Body paragraph 2- overall comparison.
Conclusion
Introduction Bp1 3catagories which show fluctuations Bp2 similar trend Bp3 higest and lowest Overall
3 body paragraphs after my introduction and overview paragraphs.
1st body paragraph.. Activities with increase hours on a yearly basis I e Watching TV, Going to pubs and shopping
2nd body paragraph.. Activities which have decrease hours. I. E Doing homework, sports
and bowling
3rd body paragraph for watching DVDs
1. 4 paragraphs with not more than 200 words.
2. Categories of the paragraphs:
i) Introduction about the bar chart.
ii) Overview of the main trend of 7 activities over the period of 6 years from 2002-2007.
iii) Body Part 1: uptrend activities with years and hours
iv) Body Part 2: downtrend activities with years and hours.
1.4 paragraphs: Introduction,Overview,BodyP1,BodyP2
2.BP1/ Activities: Watching TV,watching DVD,shopping,going to pub.
BP2/Activities:Bowling,doing homework, doing sports.
I will arrange the work into 3 body paragraphs after my introduction and overview paragraphs.
1st body paragraph will contain activities which their hours increased yearly.
2nd body paragraph will have activities with decreased hours yearly.
3rd body paragraph will be for watching DVDs
1st Watching TV, going to pubs/discos and shopping
2nd Doing home work, doing sports and bowling
3rd Watching DVDs.
There will be 4 paraghraphs.
Introduction: Paraphrase the question (1 sentence)
Overview: Main features (max. 2 sentences)
BP1: The most important features (the highest, the lowest) (2 sentences)
BP2: Other important features (fluctuations and /or atypical readings) (2 sentences)
NO CONCLUSION / NO OPINIONS
Three paragraphs
Summary
Main trend [watching tv whish was the highest and bowling which was the lowest]
Comparison [1)Tv gradually increased 2) watching dvds increaded first three years n gradually decreased 3)doing homework n sports dropped while going to pus n shoping steadily upward 4) bowling was less popular
3 paragraphs.
1. Introduction & overview
2. Household activities(watching TV/dvds, doing homework)
3. Other activities.
First Para – Introduction
Second – Overview
Third – Increasing trend & decreasing trends
Fourth – Exceptions- watching DVD & bowling
1. 4 paragraphs not more than 200 words.
2. The categories of the body paragraphs:
i) Introduction about the bar chart with the data given
ii) Overview about the hours spent in seven activities over the period of 7 years from
2002 to 2007
iii) Body part 1: uptrend of the activities from 2002 to 2007
iv) Body part 2: downtrend of the activities from 2002 to 2007
Well I would have 6 Paragraphs for the aforementioned bar graph.
The first would be an introductory paragraph, the paraphrase of the given information, highlighting the brief information about popular activities among teenagers on six different years.
Second would be describing two different activities (going to pubs/discos, and watching television) where in year 2007 these are the most popular activities among the teenagers.
Which will then be followed by third paragraph including the description of three activities (doing homework, doing sports, and bowling) where the most popular was in the year 2002 and least in 2007.
The fourth paragraph for me would be about the shopping categories where i would describe two consecutive years (’03 & ’04) and other two years (’06 & ’07) has the same number of hours per week the teenagers spend on.
The fifth paragraph will be about watching DVD’s where the teenagers in the middle two years (’04 and ’05) spend a large number of hours than in other years.
And finally, the sixth paragraph will be my concluding paragraph where i would explain what are the most (watching TV’s) and the least (Bowling) popular activities that the teenagers carries on the entire graph.
Introduction
Overall
Body paragraph1- increasing and decreasing data
Body paragraph 2-flucuate data
In writing task 1 only two body paragraphs are required. Firstly we rephrase the statement in paragraph one then after in body paragraph 1 half of the material divide and next half mention in body paragraph 2 and in overall we just only write the increase or decrease precentage.. one thing is more..if in bar graph more than one proportion is same then we just shortly explain of these items
1 There will be four paragraphs .
2 Paragraph 1 – paraphrasing the
question .
Paragraph 2 – Overview .
Paragraph 3 – writing about the most significant activity with most hours throughout that with the years
Paragraph 4 – the least activity that has low hours throughout the years.
1) Eight paragraphs: An introductory paragraph and one paragraph for each activity.
2) First is to discuss the activities with most variation in hours spent( television doing sports and watching dvds.
Introduction
Overview
BP 1 showing the ones with increasing and decreasing trend
BP 2 with varying trends
4 paras in total. First is introduction. Second is overview where I’d talk about the trend. Going forward, I’ll try to divide the rest of the information in third and fourth paragraph. That’s it!!! Maximum possible comparisons.
How would you divide the information in the third and fourth paragraphs? Which categories would you put in the 3rd and which in the 4th?
I think there will be 3 paragraphs: First background and general trend, Second detailed analysis with maximum comparisons and finally Third any exceptional feature! that’s it:)
3rd Para- Going to pubs, watching television and watching DVDs – highest lowest trends
4th Para – Shopping, doing homework, doing sport, bowling – highest lowest trends
(I could gather this information after I started following you post watching your video on Writing Task 1 Academic)
1. I would have 8 paragraphs, the introduction and 7 plotted activities will make each paragraph.
2. Each paragraph would be categorized with:
The activities
The number of hours
The year with highest imput of hours.
I would have 8 Paragraphs
First paragraph would be introduction and general overview.
In the next two to seven paragraphs i would describe activities performed by teenagers per year independently.
The eighth paragraph would be trend summery and conclusion.