An IELTS line graph and bar chart model answer with examiner comments. Describing two charts together for IELTS writing task 1 academic paper is easy when you know how. Dual charts like the one below are very common in IELTS Writing Task 1 and appear each year.
IELTS Line Graph & Bar Chart
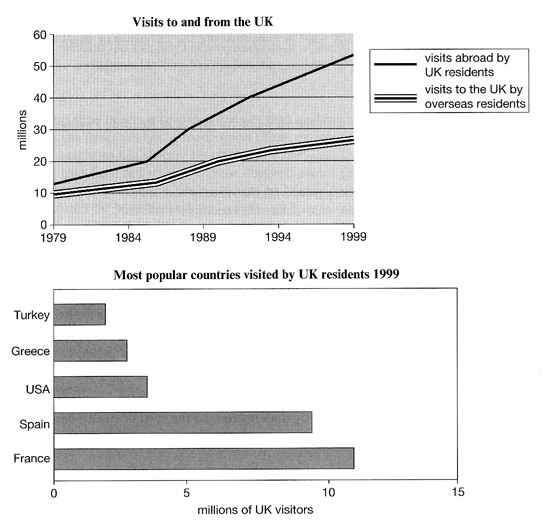
The line graph shows visits to and from the UK from 1979 to 1999. The bar chart shows the most popular countries visited by UK residents in 1999.
Source: IELTS Cambridge English Test Books
Line Graph & Bar Chart Model Answer
The line graph illustrates the number of UK residents going abroad from the UK and overseas residents visiting the UK between 1979 and 1999. The bar chart gives information about how many UK residents travelled to five of the most popular countries in 1999. Units are measured in millions of people.
Overall, there was an increase in the number of visits to and from the UK and there were more visits abroad by UK residents than visits to the UK by overseas residents over the period given. Furthermore, the most popular country to visit by UK residents was France in 1999.
According to the line graph, the number of UK residents visiting overseas began at just under 15 million in 1979 and rose significantly to reach over 50 million in 1999. Around 10 million overseas residents visited the UK in the first year before climbing steadily to just under 30 million by the final year.
Regarding the bar chart, in 1999, the two most popular countries were France and Spain (visited by 10 million UK residents and approximately 9 million respectively). The USA and Greece had about 4 million and 3 million visitors. The least popular country visited was Turkey, which had only about 2 million UK residents going there.
Examiner Comments
This IELTS writing task 1 report describing both a chart and a graph is organised into logical paragraphs. The introduction introduces both charts and the overview contains the key features of both chart. Detail in the body paragraphs is supported by data. The right language is used for the line graph and there are a range of sentence structures used throughout.
Paraphrasing
- shows = illustrates / gives information about
- the number = how many
- visits abroad by UK residents = UK residents going abroad = UK residents travelling to…
- from 1979 to 1999 = between 1979 and 1999 = over the period given
- rose = climbed
- about = approximately = around
RECOMMENDED FOR YOU:
Click below:
- Bar Chart Model Answer
- Conclusion or Overview: Tips & Advice
- Sample Charts for Practice
- IELTS Writing Task 1: ALL FREE Model Answers & Tips
.


The line graph presents the number of UK residents and tourists visiting to and from the UK between 1979 and 1999. And the bar chart illustrates the popularity of countries visited by the Britons in 1999.
Overall, the number of British people travelling abroad increased significantly in the middle of the period, in contrast to the number of foreigners visiting the UK, which increased gradually with no substantial rise in number. On the other hand, Turkey was the least popular destination for British travellers as compared to France, where majority of them travelled to in the same year.
Initially, over 10 million UK residents travelled abroad and its number increased steadily till 1984, after which it increased significantly each year to culminate over 50 million in the final year. Conversely, the number of tourists in the U.K hovered around 10 million until around 1984, after this the number of foreign travellers in the U.K only increased gradually to less than 30 million in 1999.
Turning to the Bar chart, in 1999 only around 2.5 million Britons travelled to Turkey, similarly, the number of visitors to Greece and USA remained consistently less than 5 million in the same year. In contrast to Spain, where less than 10 million U.K residents travelled to and just more than 10 million to France.
Hi Liz,
Excellent content as always! I love it. However, I can’t seem to squeeze this report down to under 190 words. Could you help me take a look? Thanks!
The line graph illustrates the number of people traveling to and from the UK between 1979 and 1999. The bar chart gives information about the volume of UK travelers to 5 countries, namely Turkey, Greece, the USA, Spain, and France in 1999. Units are measured in millions of people.
Overall, the number of people going in and out of the UK both increased in the 20 years given, the latter of which saw a much more significantly rise in number. France was the most popular destination for UK travelers.
According to the line graph, the number of visits to the UK began at just about 10 million people in 1979, which then rose steadily to over 25 million people in 1999, while the number of UK residents visiting other countries started at over 10 million people in 1979 and approximately increased five-fold in 20 years.
As seen from the bar chart, in 1999, France and Spain witnessed the largest influx of UK visitors, with France having approximately 10 million and Spain roughly 9 million people. The USA and Greece had about 4 million and 3 million visitors, respectively. The least popular country visited was Turkey, which received only around 2 million UK residents.
When I say that you should aim for between 170 and 190 words that is not a rule. It is advice. Some charts, tables etc may have so much content that your report might reach 200 words or 210 at most. Other tasks might have so little information that you might only write about 170 words. Writing too much is a problem if you get lost in too many small details without grouping information together and spotting key features. So, if you are sure you’ve focused on main features without getting lost in detail and your writing is around 200 words, it’s fine. And don’t forget to have two body paragraphs.
Hi Liz, I’m going to take my IELTS Test in next 2 weeks and I’m a self-learner. Could you please rate my answer roughly? so I will have a better idea about how’s my writing standard in Task 1. Appreciate if you can review and left your feedbacks! 🙂
The line graph compares the number of UK residents travelling overseas and how many tourists from other countries visited the UK over the period of 20 years. The bar chart illustrates the top five countries which are visited the most by tourists from the UK in the year of 1999.
It is clear that there is an increasing trend of UK residents to travel overseas between the years of 1979 to 1999. At the same period of years, a similar trend could be seen in the number of overseas residents visiting the UK. In 1999, the highest number of UK tourists was recorded in France while Turkey had the lowest number of tourists over the same year.
In the year of 1979, the number of UK tourists and overseas tourists started around 10 to 11 million according to the line graph. However, the frequency of UK residents travelling abroad was increasing rapidly after 1984, reaching a peak of almost 52 million in 1999. A significant rise can be seen in overseas visitors to the U by increasing from 20 million in 1989 to 28 million in 1999. The difference in the number of tourists from 1979 to 1999 is less than 20 million only.
Based on the bar chart, France was the most popular country to be visited by UK Residents in the year of 1999 with a total number of approximately 11 million, followed by Spain which had around 8 million of visitors in the same year. In contrast, only around less than 3 million of UK residents travelled to Turkey, making it the least famous country. Both Greece and USA had less than half a million of visitors which are around 3 million and 4 million respectively.
Thanks 🙂
Although I don’t offer a feedback service, I do have time for a quick comment today.
This is a very long report. Almost 290 words. Your aim should be between 170 and 190 words on average, with 200 (max 210) words at the absolute outside limit. Writing longer will a) waste time b) adversely affect your marking.
See if you can cut it down and make it shorter. Remember, you don’t get a high score for a longer report. You’ll often be marked down for a longer report.
Thanks Liz for your kind reply, I don’t expect will get a response within such a short time. I will take note on this!
In introduction for bar graph can I write the following :
Whereas the bar graph illustrates the 5 most preferred travel destination of the resident of the Uk
Please watch this free video lesson which takes you step by step through precisely how to write an introduction for writing task 1: https://ieltsliz.com/introduction-paragraph-for-ielts-writing-task-1-reports/
Hi Liz, Thank you very much for such a great content. I just had one question , Do I need to mention all the information given in the bar chart , because in my essay I only spoke about France Spain and America ? will that be enough ?
This line graph and bar chart contains little information. To miss part of it will reduce your score significantly. If you get a task with lots and lots of information, you group categorise together. That way you don’t miss anything.
Dear Liz,
I heard about the importance of incorporating hedging in the writing tasks for IELTS Academic. Would it be appropriate to add hedging like this “Overall, there appeared to be an increase in the number of visits to and from the UK, and there seemed to be more visits abroad by UK residents than visits to the UK by overseas residents over the period given. Furthermore, it appears that France was the most popular country to visit among UK residents in 1999”.
Or,
Hedging should be applied solely in writing task 2?
Thank You!
This should never be done in writing task 1. Your aim is to provide factual information of what is in the chart. Either there was an increase or there wasn’t. It isn’t about an appearance of trends or data. Be precise.
The reasons this is sometimes advised for writing task 2 is because if you overgeneralise, your score will go down. For example, people enjoy taking holidays abroad” should be “many people enjoy taking holidays abroad” or “the majority of people enjoy taking holidays abroad”. And in a similar way, you might refer to “the appearance” of a trend instead of giving absolute statements. But the way you have written your example shows an overuse of this which won’t really help.
Hi, there is a small error as you have written bar chart instead of line graph and vise versa in the first sentence of each body paragraph.
Very well spotted. I need to hire you for proof reading my typos 😉
Hi Liz,
How are you? 🙂 This is Lily from China. Thanks for your reply to my inquiry on another topic.
I have a question regarding the model answer here. Do we need to compare the data for lines in the line graph as I noticed that each line was described independently without being compared to the other line?
Thank you so much! You’re the best IELTS teacher.
It’s a good question and I’m glad that you noticed my line graph model answers are structure that way. People get very confused about the idea of “comparing” in Writing Task 1 Academic test. Bar charts are designed to be compared, category by category, column with column. But this isn’t the case with all other types of task 1. Diagrams, for example, rarely have any comparisons because your task is just to present the stages in a logical order, not compare them. With line graphs, it is about trends. If each line has completely different trends, you’ll just be presenting information about those trends and any comparison might only happen in the overview – just one or two sentences. There is no fixed rule. It depends on the type of task and the information in the graph, chart, table, map and diagram. That is why I have created a number of model answers so you can see the layout and content – what stays the same and what differs.
Many thanks for your prompt response! It helps a lot. 🙂
All the best!
Hey Lily have you written your IELTs yet? I am writing this from China
the line chart illustrates visits to and from the UK between 1979 to 1999 .the bar graph shows information about millions of UK residents visiting Turkey, greece, usa, spain and france in 1999.
As we can see that UK residents visiting other countries is increased rapidly. France is the most famous country visited by United kingdom people.
in, 1979 visits to abroad is more than 10 millions it had increased to 20 millions. similarly overseas residents is 10 million after 5 years. By the end of 1999 it reached the peak over 50million, whereas the abroad residents population is grown significantly upto 30 million.
France is the most visited country by Uk residents where more than 10 million people visited in a single year 1999. spain is the second most famous country with nearly 10million visitors. The least visited country by UK residents was turkey. less than 5 million people had visited USA, greece and turkey.
The data provides information on monthly temperatures and annual sunshine in three main cities(London,New York and Sydney).
Overall, the temperatures per month varied across the three cities throughout the year.Sydney experienced intense heat than other regions at the beginning and ending of the year, while at mid-year, London and New York had hot climeates than Sydney. New York had the highest temperature and longest hours of sunshine but London had the least.
Sydney witnessed hot weathers from january till march at 25 degrees, after which it reduced gradually to its coolest at 20 degrees in july. During these periods, temperatures in New York and London rose from 5% and 10% to 29% and 24% respectively in july were the had their peak. Both cities afterwards had a decline in their degree of hotness falling to about the same temperatures the started the year with(5 and 10) degress respectively, but Sydney maintained a hot climate for the rest of the year at 25 degrees in december also similar to its temperature at the start of the year.
In terms of sunshine hours, New York had the longest duration at 2,535, while London had the shortest at 1,180.
Good day liz, i know this response is not connected to the above question. This my response to writing task 1 of test 8 in cambridge ielts study guide. Please kindly review my writing as am using your blog and the study guide to practice. Exam is in two weeks.
Thanks From Nigeria
I don’t offer a feedback service, but I will make a few points which I hope will help you and others regarding the overview.
1) The sentence “…temperatures varied across the cities….” is a pointless sentence. It has no significance. All line graphs show variation. If they didn’t show variation, they would all be a flat line. So, don’t write any sentence that isn’t 100% meaningful and relevant. There are few sentences in a writing task 1 report and each sentence must carry a lot of importance.
2) The graph shows countries, not regions. If you are not sure of your paraphrase, don’t change the word.
3) To say a country has a hot climate means that it is hot all year round. This isn’t the case for New York and London. You need to use the word temperature. So, this is a second example of attempting to paraphrase without success. This is one of the main reasons people can’t hit band 7 in vocabulary. If you are not sure, don’t paraphrase. It is better to be accurate than inaccurate.
4) You stated that New York had the highest temperature and the longest sunshine – then you state that London had the least. But this isn’t true. London didn’t have the lowest temperatures even though they had the least sunshine. The problem with this sentence is that you are trying to give an overview for two different charts in one sentence. Don’t mix them up inside one sentence. Put one or two statements for the line graph and then one statement (sentence) for the table. Don’t confuse different pieces of information.
Here is an example overview to help you understand how to present information in a simple, logical manner for a high level report:
Overall, Sydney saw their highest temperatures at the start and end of the year with midyear being the coldest, whilst New York and London witnessed the opposite trend. New York witnessed both the hottest and coldest temperatures of all countries. Furthermore, Sydney and New York both saw longer hours of annual sunshine compared to London. (Note: the second sentence in the overview is optional.)
When you describe a line graph in the body paragraphs, do one line at a time. Don’t confuse your information. See my model answer on the page above.
The line graph illustrates the number of UK residents visiting abroad and that of tourists coming to the UK in million between 1979 and 1999, while the bar chart depicts five countries with the highest UK-visitor count in the year 1999.
Overall, the number of visitors travelling overseas far exceeded that of the tourists coming to the UK by the end of the given time frame despite both showing upward trajectories. Interestingly, France and Spain received significantly more visitors than other nations.
Regarding the line graph, the trends for the UK citizens leaving the country and the foreigners encountered by the UK stood at around 12 and 10 million, respectively, after which the former rose gradually to reach 20 million by roughly 1986, as opposed to the latter by approximately 1989. From 1986 onwards, the graph for the British travellers skyrocketed to finish the period at almost 55 million, whereas that of the international ones saw a gradual rise, ending the 20-year interval at nearly 30 million.
As for the bar chart, over 11 million people went to France in 1999, compared with 9 million for those entering Spain. Meanwhile, the data for the remaining countries includes 4 million for the USA, 3 million for Greece and 2 million for Turkey.
The line graph gives information about the total number of visits by UK residents going abroad and overseas UK resident visiting United Kingdom between 1979 and 1999, while the bar graph illustrates the five different countries visited by the residents from UK in 1999. Units are measured in millions.
Overall, it is clearly seen that the number of UK residents going abroad is higher than to those residents from other country who are visiting UK throughout the given period. Furthermore, France was the most visited country by the UK residents in 1991.
In the beginning of time, the number of people going in and out of the United Kingdom was at 10 and approximately 12 million respectively, both of these numbers increased over time. In 1999 there was huge difference in the numbers of people entering and exiting the UK with a total difference of 20 million approximately.
France was the most visited country by the natives of UK among other countries in 1991 nearly 11 million which is followed by Spain at just below 10 million. The number of visits in three remaining countries just fall below 5 million and Turkey was the least among them.
The line graph illustrates the number of visitors coming from overseas to the UK and UK residents going abroad in a period of 20 years from 1979 to 1999, while the bar graph specifies the most popular destinations residents of the UK chose to visit in the last year of that period, units are measured in millions of people.
Overall, both visitors coming to and leaving the UK soil increased with time, however, the number of visits abroad by UK residents was significantly greater with France and Spain as the two most popular countries chosen by the British.
With regards to people traveling to the UK and from it, the numbers used to be low for both at the beginning of the studied period with 10 million people entering the UK and slightly over 10 million heading abroad. However, the numbers rose steadily then jumped for people exiting the UK to just over 50 million and gradually for people entering it to nearly 30 million.
In 1999, Spain (almost 10 million visitors) and France (over 10 million visitors) were the most popular choice for people from the UK considerably exceeding the number of British people choosing to visit the US, Greece and Turkey (All under 5 million of UK visitors).
Hi Liz, you are a wonderful teacher. Thank you for all the study material that you have provided for the exam.
You’re welcome 🙂
Hello Liz.. your lessons so far has drastically reduced my exam phobia.. simplified nd easy to understand.. thanks alot.
I hope ur health is getting better .. I wish you a sound nd quick recovery.
I’m glad you are feeling more relaxed. Gaining insight into the exam and doing plenty of practice always helps. Good luck!!
The line graph given below illustrates the both-side visitation in the United Kingdom over the 20 year period. The bar chart gives information about the most famous countries that UK citizens visited in 1999.
It is obvious that there was an increase in the number of visits from and to the UK, but there were more visits abroad by the UK residents rather than the UK by the foreigners. Furthermore, the most prefered and visited country by British visitors was France.
The number of visits abroad by the UK residents was almost 10 million in 1979, while the number of visits by overseas residents in 1979 was just the same. Over the 15 years, both rates faced growth and reached almost 40 million for the UK citizens visiting abroad and about 20-25 million for the outlander visitors in the UK.
In 1999, France was visited by 10 million UK residents, followed by Spain with 9 million, The USA and Greece with almost 5 and 4 million. Finally, Turkey which had only about 3 million UK visitors.
(It is kinda similar to your example but it is my first task 1 like that, I would be happy if u just take a look at it 😉 )
The given line graph illustrates how many visits came from abroad to the UK and residents of it who travelled abroad between 1979 and 1999, whereas the bar chart depicts six different countries, eminent among the UK residents in 1999.
Overall, it is quite evident that the visits to and from the UK rose over the period given, while Spain and France been the most popular countries visited by the UK citizens.
In terms of line graph, the trend for both visits to and from the UK, was increased steadily from about 10 million to exact 30 million and approximately 20 million between 1979 and 1989, respectively. From that point, it soared to reach a peak of just over 50 million in the last year for visitors from the UK. Likewise, the figure for visitors to the UK climbed gradually to almost 30 million at the end of the period.
With regard to the bar chart, around 10 million UK citizens visited the Spain and France, while other countries were the least enchanting among them as the figure was less than 5 million for those countries.
Please assess my report and how many bands I can get from it?
The line graph describes how many travelers had visited the UK and left the UK for overseas between 1979 and 1999, while the bar chart gives information about the top five countries, France, Spain, the USA, Greece, and Turkey, where the British people visited the most in 1999. Overall, the British residents, who went overseas, had always outnumbered offshore residents, who visited the UK, for the given period, meanwhile, most British travelers preferred a journey to France.
From 1979 to the mid-1980s, overseas travel and travel to the UK had gradually increased from 13 million to 20 million and from 10 million to 13 million, respectively. Afterward, the pace of both travels had been accelerated, and over 50 million people flew overseas, and above 25 million visitors came to the UK in 1999.
On the other hand, in 1999, among over 50 million British people, around 20 percent of them, over 10 million people, went to France. However, the number of people who visited Turkey is only two to three million.
During the same period, the number of visitors to Spain is less than 10 million, and that of visitors to the USA and Spain is lower than 5 million.
Thank you very much for your generous support.
Yes oooo. She’s been so helpful!
Thank you so much for your helpful tips. This website helped me get a band score of 8.5.
Best,
Niharika
That’s wonderful. Very well done 🙂
Hello Liz where are you now? We all are missing you🥺
I’m really struggling with my health right now. Hopefully, I’ll see some improvement later this year.
I wish you a speedy recovery
Get well soon, Liz.
Thanks
when I see this message from Liz, my eyes tear up.
hope you will recover soon, and I ask Allah to you hidaya.
Thank you
Wishing you a speedy recovery teacher LIZ. I still watching your old youtube videos and they are just amazing. May god bless you.
Thanks
Hello Liz!
Your lessons are excellent and I am using them to prepare for my IELTS exam. I had one question. Is it important to include a conclusion for Academic Writing Task 1?
Writing task 1 has an overview which contains all key features that are collected together and presented for the first and only time. Writing task 2 has a conclusion which repeats in short your main points.
the line graph illustrates the number of visitors to and from the british country in between 1979 to 1999.overall,the figure experiance more number of u.k residence by comparing with oversea residence and the most view country by uk residents is france.
to begin,the u.k resident travelled with above 10 million visits,meantime overseas residents begin with 10 million people.the u.k residence trend has rising graduvally to more than 10 million visits for every 5 years,meanwhile in overseas residents a steady increase has taken place ,more than 50 million and and less than 30 million respectively.
IN 1999,the most popular country visited by u.k residents is france nearly 12 million visitors,followed by spain then turkey having the least number of visitors approximately 2 million .the remaining counties 4,3 million view respectively.
FOR THIS WRITING TASK 1, HOW MANY BANDS CAN I GET .IF THERE IS ANY PROBLEM PLEASE SUGGEST ME.WITH A KIND REQUEST
1. The letter of first sentence must be Capital Letter, 2. not ‘british country’, say UK or England, 3. not ‘experience’ say shows, 4. not ‘most view’ say most visited
5. Use capital letter as UK. 6. Your message should be clear
Double graph become Illustrates ,not illustrates
I don’t understand your comment. There is only one line graph. “The line graph illustrates” is correct.
Hi! Can i write more than 150 words in report writing?
What do you mean? The instructions tell you to write OVER 150 words.
The line graph illustrates the number of visits made to the UK by foreigners as well as the number of trips made by UK citizens to foreign countries from 1979 to 1999, and the bar chart displays the five countries which were frequently visited by UK citizens in 1999.
Overall, the trips of UK citizens to abroad increased significantly during the given period and were more than the visits to the UK, whereas the visits to the UK rose only moderately. France was the most popular country among UK residents.
In 1979, about 12 million British travelled to foreign countries, which was approximately 2 million more than the tourists in the UK. The number of trips taken abroad by UK residents rose markedly throughout the given period, and reached a high of about 51 million visitors in 1999. However, the number of non-UK residents visiting Britain reached only about 27 million in 1999.
France was the most visited country by British, and it saw approximately 12 million visitors in 1999, which were about 3 million more than the travellers to Spain. In contrast, less than 5 million UK residents travelled to the USA, Greece and Turkey, and Turkey was the least popular with approximately 3 million British tourists.
it looks much better than the model answer! think the model answer lacks of comparisons in body 1 and 2. so is it worth band 9?
Hi Liz,
I’m an avid fan from the Philippines. One question. Is your writing format from idp? I’d like to take my exam under British council and my tutors told me the testing centers have different styles. Awaiting for your reply! Much love. 🤗💕
There is no difference between IELTS at BC or IDP. Cambridge write all tests and the tests are run at both centers. The marking is the same – everything is the same.
Hi Liz. We heard that format is way different with BC. I see that the overall part of your introduction is on a separate paragraph wherein if it is in BC, they would be in the same paragraph, introduction + overview.
BC and IDP are both owners of IELTS. They both follow the same marking criteria – 100% the same. They are not different. If you had seen all my model answers for writing task 1, you would see the full variation of paragraphing that is possible. Have you read all my model answers? Have you read all my lessons on writing task 1? They are access through the RED BAR at the top of the website.
The line graph illustrates the number of UK residents going abroad from the UK and overseas residents visting the UK between 1979 and 1999. Instead of this can we say UK residents who went abroad from the UK and overseas residents who visited the UK between… what is the difference between the two.
The difference Nitish is only in your grammar and expression. Both, of course mean the same. There are a number of ways to handle the introduction. Yours is a nice one.
Try this …..The line graph depicts the number of UK residents going overseas on visits and the number of foreign visitors coming to visit the UK during a period of 20 years between 1979 and 1999.
It is good but if you will try this…
The given linear graph reveals about the information how many British residents going overseas on visit and foreign visitor coming in UK during a two decades in between 1979 and 1999.This data calibrated in number of visitor and which was visiting in another country by UK in 1999
Hi Liz. I would like to say thank you for your assistance. By God’s grace i had a total band score of 7.5 with the least of the element being 6.0. Your teaching skill is impeccable and second to none.
Once again, thank you.
My exam questions were as follow;
Speaking test
Home town
Rain
How does rain affect mood
How i handle patience
Most important letter i have received
Can a letter be a historical element
How safe is a manual letter
Writing Task 1
A pie chat and a bar chat illustrating the amount of drinking water consumed by seven countries and the level at which the water was consumed by each country; respectively.
Thanks for sharing and very well done – great score 🙂
You wrote around 200 words for this writing task 1 is that ok? we can write 200 words or more than that in task 1?
Most students will aim for between 170 and 190 words. I don’t recommend going for 200 words or more (unless you are a native speaker).
Which is better to use to start an overview: overall OR it is clear/evident that? Thanks in advance.
Which one do you think clearly shows that the statement is an overview? This is about making things clear. The more logical and the more clear it is, the better for the examiner and the higher the band score. Report writing is about making information easily accessible.
Hello:)
Shouldn’t there be a conclusion always?
Because we were always taught so.
See this page: https://ieltsliz.com/ielts-tips-conclusion-or-overview-for-writing-task-1/ and then check the main writing task 1 page: https://ieltsliz.com/ielts-writing-task-1-lessons-and-tips/
Hi Liz,
Can I say ‘British’ instead of ‘the UK citizens’?
Thank you!
Of course.
Hi ma, the 3rd paragraph does not give all the information in the line graph, You picked only the highest and least data from the line graph.
Are we not supposed to give information about all the data on the line graph or bar chart?
You are not supposed to present all data when you have so much information. You are being marked on your ability to select information. If you present too much small detail you will get band 5 for Task Achievement, which is 25% of your marks for task 1.
Can I skip the line in IELTS writing sheet which says “Do not write below this line” because sometimes that statement covers my actual words?
Thank you.
Your writing should be clear and easy to read at all times. You do not write on that line or below that line.
what is the difference between steadily increasing and significantly increasing ?
is this line graph increasing steadily or significantly?
Steadily means over a period of time. It means the same as gradually. However, significantly refers to the amount – a lot.
Can we use “there was a moderate rise” instead of “steady increase”?
Sure. But don’t forget that they have a slight different meaning. A moderate rise means that it isn’t very big. A steady rise is about not being too big over a longer period of time (it involves the length of time).
Is it okay to use “skyrocketed” for significant increase?
We could use “rocket” as a verb but not “skyrocket”.
Hi Mae, somewhere I have seen the following sequence that describes a continuum progression level:
Minimal < Slight < Gradual < Moderate < Considerable < Substantial < Significant < Enormous < Dramatic
I have found the above order is useful in describing 'change' in Task 1. However, I am requesting Liz to correct me if I am wrong.
See this page: https://ieltsliz.com/how-to-ielts-line-graph/ and then review this page: https://ieltsliz.com/ielts-writing-task-1-lessons-and-tips/
Hi maam
Can you tell me
How i prepare the writing task 1 and 2
For free lessons, see this page: https://ieltsliz.com/ielts-writing-task-1-lessons-and-tips/ and also this page: https://ieltsliz.com/ielts-writing-task-2/. For advanced in-depth training, see my advanced writing task 2 lessons: http://subscriptions.viddler.com/IELTSLizStore
Dear Liz,
Is there a plural form ‘s’ after million in 15 million and 9 million in the context expressed above?
Linh
No. We never write an “s” when expressing 15 million people or 20 thousand sales. We only write an “s” when we write “there were millions of people” – without any numbers.
hi LIZ
your writing method is fabolous
can you help me for writing task 2
See this page for my free tips: https://ieltsliz.com/ielts-writing-task-2/ or see my advanced writing task 2 lessons to purchase in-depth training: http://subscriptions.viddler.com/IELTSLizStore
Is it safe to write on the last part: “The least popular country to visit was Turkey which had only been visited by 2 million residents”?
Sure that’s fine.
I love your way of teaching. I wish I can write like you :S lol I am practicing my task 1 writing for ielts and I loved your way of explaining more than the rest. thank you so much <3
Do you have a video on YouTube for this essay ??
https://ieltsliz.com/liz-notice-2015-2016/
HI,Liz I am Dilya. I am going to take IELTS exam on 21 of the may.But I am bad at writing task 2.Please help me to improve my writing task 2. Thank.
See my advanced writing task 2 lessons: http://subscriptions.viddler.com/IELTSLizStore
All the best
Liz
Thanks a lot Liz
Why is there no conclusion in model answer? There should be conclusion in the end.
There is no conclusion for task 1, only an overview. See the main writing task 1 page to learn.
Liz
Hi Liz
Is it okay if the overview is pretty long? I mean all the “key features” has to go in overview. I can see your this “overview” is very long.
Please explain me !
I’m looking forward to hearing you at your earliest convenience.
https://ieltsliz.com/liz-notice-2015-2016/
Hi Mam
Is it necessary to to have overall in second paragraph?
Or its fine if I have it in the last?
I find that More easy
https://ieltsliz.com/liz-notice-2015-2016/
Hi Liz,
Can I say that The number of UK resident visiting overseas began at just under 15 m in 1979, but had risen significantly to reach over 50 m by 1999?
Kind regards,
Adam
https://ieltsliz.com/liz-notice-2015-2016/
Hi Liz,
Thanks for your fantastic work!
I’m a bit confused about when to paraphrase because sometimes I spent too much time on thinking how to paraphrase the sentences .
I saw you just copy the key in the line chart directly such as “visit to and from the UK”, “visits abroad by UK residents” and “visits to the UK by overseas residents”. Is it okay not to paraphrase these words?
Please advice!
Thank you very much!
Of course you can use the words given. But don’t use them all the time. From time to time, offer paraphrases. I don’t know why students think they can’t use the words given. It’s normal and right to use them but just don’t use one phrases again and again and again.
Liz
Thank you very much! 🙂
Dear Liz,
I totally agree that writing task 1 should include an overall paragraph. But the model answer of the writing task 1 in Cambridge IELTS 9 does not have one. How could a model answer provided by the official does not comply with its own band descriptors?
Best wishes
Because IELTS can’t afford to make their own test formulaic. If they did that, the test would no longer be challenging. IELTS are not going to reveal the paragraph structure to students when paragraphing counts for 25% of the marks.
Liz
Thank you very much! ^_^
Can we use numerical value like mentioning year 1997 in overview/conclusion?
An overview usually contains key features rather than detail. There is no conclusion in task 1.
All the best
Liz
Thnx a lot
Hi mam
Can we write overview and intoduction together in the same paragraph?
Yes, the two statements can be put in the same paragraph if you want.
Liz
Hello Liz, do you have a format I can follow if there are two illustrations for task 1? Thanks in advance!
See my main writing task 1 page: https://ieltsliz.com/ielts-writing-task-1-lessons-and-tips/
Liz
isk not conclusion necessary in writing task 1?????
No, you don’t need a conclusion. The examiner is looking for an overview. See my overview lesson on the writing task 1 main page.
Liz
Hi Liz,
I’ve gone through all your videos and read almost every post on your blog. I’m taking the exam this thursday and would like to thank you for all your video’s and posts! I took the IELTS exam a couple of months ago and scored an overall of 8. L-8, R-8, W-6.5, and S-9.
Hoping to improve on my writing to at least a 7 this time. If there is any last minute tip you could give me, I’d really glad.
Thank you.
The key is understanding what you need to do for each type of question. You must understand what you can and cannot write when the instructions are “to what extent do you agree”. Also you must avoid taking chances with vocabulary. Paraphrase only when you are certain. Avoid over long sentences – use punctuation. Plan your essay, plan how you will use paragraphs. For task 1, make sure you write a very very strong overview if you want to get band 7. And don’t write a conclusion. Good luck!
Liz
The line graph clearly depicts the travel to and from the UK, by people who live in the UK and abroad between 1979 and 1999, while the Bar chart illustrates the number of travelers from the UK to different five countries in 1999 in millions. At a glance, the Uk dwellers loved to tour foreign nations where France was the favorite destination of all.
The citizens going out from the UK was under twenty million till 1985 and then it soared to above fifty million in 1999. Comparatively foreigners to Briton were low, maintaining a linear growth initially and climbing up gradually to reach just under 30 million in 1999. During the tenure from 1979 to 19999, more traveling happened to outside the UK than into the UK.
Approximately, 12 million Britishers visited France, followed by Spain with under 10 million people in 1999. In contrast, Americ.Greece and Turkey were the least opted place to go by the UK residents, which witnessed an influx of merely 5 million people in that year. The visits made by the English men or women to France and Spain were two-fold higher than the numbers to the other nations put together.
In short, tourism blossomed after 1985 in many countries especially, where it reached its peak in 1999, evidencing most visits to France.
Please read my notice: https://ieltsliz.com/posting-writing/
Thanks
Liz
Hi miss Liz ,
can we consider “visits to the UK by overseas resident” as ” overseas resident who had visited the UK by 1999 ” ?
or the y-axis is the number of visits not people who visited ??
can you explain this point please .. ?
Regards,
Your first option is fine “overseas residents who…”. I wouldn’t change it to visits, if the graph is about the number of people.
Liz
Thanks . 🙂
Respected Madam could you please point out the mistakes in this answer.I fear what score I might get for this?
The line graph compares and contrasts data on changes in the number of tourists visiting UK and the number of overseas visits made by the British over a 20- year period from 1979 to 1999,while bar graph compares the differences in the popularity of 6 different countries amongst the British as the tourist destination in the year 1999.
Overall,the number of tourists to UK as well as the number of British moving out as travellers rose over the given period,and two of the six countries were more liked by British as tourist destinations in the year 1999.
More specifically,initially the figures of visits of UK residents and overseas travellers to England were nearly 11 million and 10 million respectively,both of these rose over the periods despite a common dip in figures during the 1985-86 time,following which a steady rise in numbers of UK travellers could be noted resulting to over 52 million in 1999 which was almost double the number of tourists to UK of that time.
During the year 1999,the most visited country by the English was France with 11 million visitors and Spain was the second most liked nation to travel to with nearly 9 million people.Although USA,Greece and Turkey were also visited the numbers were comparatively less than that of France and Spain with almost 4 million,3 million and 2 million visits respectively.
Please read my notice: https://ieltsliz.com/posting-writing/
Thanks
Liz
Hi Liz,
This topic is quite helpful. Thank you.
Concerning the sentence “In 1999, France was visited by over 10 million UK residents”. I think you are correct in using “residents”. If residence is the proper word then it means “home, house or address”. I’m confused? What about “France was visited by over 10 million residence of the UK”? Is this right or it suggests a different meaning?
It was just a typing error – sorry. You definitely can’t use “residence” because this is referring to people not housing.
All the best
Liz
Dear Liz mam,
Iam Rashmi from India,I’m very poor in writing especially introduction and conclusion are toughest parts.please help .
There are plenty of models essays and model reports to learn you see how to write each paragraph. Please see the relevant section.
All the best
Liz
Thank you Madam ! for your kind suggestion !
Dear liz, thanks for your efforts, can i use ” across the Uk “in intro in place of “to and from the Uk”.Secondly I got 6.5 in writing,having such score indicate what level,and mistakes.
No, it would have a different meaning. “across the UK” means all towns, cities and villages” but “to and from the UK” means people coming to the UK and leaving the UK. Band score 6 is made of band score from 4 marking criteria so I don’t know what actual score you got for grammar or vocabulary. But generally Band Score 5 = frequent errors / Band score 6 = some errors / Band score 7 = few errors. Here’s a link to learn more: https://ieltsliz.com/ielts-writing-task-1-band-scores/
All the best
Liz
thankyou liz
Dear Madam,
I have been preparing my ILETS course from your you tube channel and website. Which is really helpful to me for my writing tasks. Mam,these days I am tittle bit nervous about on writing task1 so that i cannot concentrate to my study. Hope you will be give me some sorts of solution on that ! Take care !
Saroj Wagle
Your nerves are probably due to the fact that you have no clear strategy for each type of writing task 1. You need to know exactly how to write the introduction, how to write an overview for each type and then how to divide the information into two body paragraphs. I suggest you look at my models. Look first at each introduction and notice how it is written for each type. Then look at each body paragraph and compare them.
All the best
Liz
hello mam! iam following your lessons regluarly its been so useful and thank you mam.
i have small query can i write both agree and disagree opinion in writing task 2, can you please tell me which is better!
No, you can’t agree and disagree. You must have a clear position or you will get a lower score for Task Response (25%). You can present a balanced view but that is where you neither fully agree or fully disagree but present a specific opinion. The only lesson I have made for this type of approach is my paid lesson: http://subscriptions.viddler.com/IELTSLizStore
All the best
Liz
thank u mam!
Hello Liz,
If the given line graph has more ups and downs over the given period, then is it necessary to mention each and every rise and fall with the figures? or it can be generalize over the period?
Because mentioning all the details may increase unnecessary complexity as we as consume time.
Thanks.
Please read the band scores carefully. If you give too much detail, you will get a lower score. You are being marked on selecting information: https://ieltsliz.com/ielts-writing-task-1-band-scores/
Liz
Now that was a great explanation, I enjoy with your writing style.
My examination will be after four days.
I just want to tell how much I have benefited from both of your website and your YouTube channel.
Above all that, I didn’t know that there was an overall needed before I found your YouTube videos.
So thank you very much Liz.
Good luck with your test 🙂
Dear madam.
I am glad to inform you that your lectures and videos are helping me to improve
My preparation.Now please send me some writing tips videos in my email address
I shall be thankful to you
Regards
Mehran umar
All videos are currently stored on this blog and also my youtube channel (IELTS Liz). I don’t have any more. Although I have just started making my online course but only one lesson is currently ready to purchase: http://subscriptions.viddler.com/IELTSLizStore
Liz
Hellow LIZ..In writing task-1, last para you used “France was visited by over 10million..”could you plz tell when & why we use ‘..by over..’?
Thanks Liz
The preposition “by” is used to refer to people “visited by 10 million people”. And the word “over” refers to the number “over million”. So the sentence “visited by over 10 million residents” means that France was visited by UK residents and there were over 10 million of them.
All the best
liz
your lessons are helping me alot. i want to check mistakes in my writing would you please check my writing and tell me what are drawbacks.
Sorry but I don’t offer essay marking or feedback at present.
Liz
Thank you for this example Liz!!!
Hi, thanks for the post. I have followed ur website as this is very useful.
I have acquired L-7 to 7.5, R-7 to 7.5, S-7.5 but I always got 6 to 5.5 in writings.
Could you give some suggestions on how to improve on my writing score? Why do you think the reason for getting a low mark in writing score?
It hard to say without seeing your writing. Here are some things to consider:
Writing task 1
Do you put ALL key features in a clear overview? Do you avoid the conclusion?
Do you support sentences with data in the body paragraphs?
Do you organise information into two body paragraphs logically?
Do you use appropriate linking devices for the task?
Do you use the right language and make few errors?
Writing task 2
Do you address ALL issues in the essay question?
Do you give a clear answer (main points) in your thesis statement?
Do you write strong topic sentences which connect to the essay question at the start of each body paragraph?
Do you use a range of linking devices?
Do you avoid over paraphrasing to avoid mistakes?
Do you aim for accuracy in your English? If you try to impress the examiner, you will make more mistakes and your score will go down.
Think about these points carefully as they could be the reason you fail to get 7.
All the best
Liz
Dear Liz,
Thank you for all efforts.
I want to know whether it is possible to change second paragraph third line ”over the period given” to ” over the given period”
Yes, both can be used.
All the best
Liz
But how I improve in all modules. ..
You need to develop all aspects of your English. Band score 5 = frequent errors. Band score 6 = some errors. Band score 7 = few errors. Learn about the band scores, learn how they are assessed and improve your English. When your English is stronger, you can think about IELTS skills. All band score information is given in each section of this blog.
Liz
Hlo maim. .
I got 5 band in ielts. ..In which my score ..listening 5 , Reading 5.5. Writing 5 and Speaking 4.5. . So . I want improve my all modules. ..Plzzzzzzzzzz Help me .For my next exam
If you got band score 5 on average, it is due to your level of English. To get a higher score, you will need to develop your English language to understand it in more detail and to be able to produce it more accurately.
Liz
Thanks Liz:
in last paragraph, first line, is it Ok to say ” France was visited by over 10 milion UK residence”?! or ” residents” ?
Thanks. Well spotted!
Liz
Ok thanks. 🙂
Hi Liz!
I hope you are doing good. you are a wonderful teacher with a pleasant smile always which made me score (7.5) overall band. I got (7 in listening, 7.5 in reading,8.5 in speaking and 6 in writing). Despite scoring 7.5 im not eligible to sit for my PLAB because i had to maintain 7 in writing too which unfortunately i could not. I am a bit upset because i studied very well. Now i want to ask you your writing package for essay writing(academic) includes task 1 and task 2 or yet you have to upload them.
Waiting for your reply,
Regards,
Dr.Gauhar
Unfortunately, my writing task 2 course might not be finished until the end of summer, possibly even October. I’m not sure when my writing task 1 will be ready. It takes me quite a lot of time to film and edit the lessons. As soon as a lesson is ready, I’ll post a notice.
All the best
liz
hi miss liz ,really this is great information for writing task 1 and its helpful for me because my ielts test is on 13 august .thank you so much.miss liz its my request if i send you my writing tasks would you like to check ?
Unfortunately, I don’t offer essay marking or grading services. I’m glad this model was useful.
All the best
Liz
Hi Liz , can i write symbolic currency? For example, 500K million?
and how can i write pound sterling in a more easier way ? because it takes more time to write 100 thousands pounds sterling. I am from Bangladesh. And following your technique for my ielts
£100,000