A Model Bar Chart of Age Groups for IELTS Writing Task 1. Use flexible language for describing age groups and don’t get too lost in lots of detail. Use the model answer below to guide you. Charts, tables and graphs showing age groups appear every year in IELTS Writing Task 1 (Academic Test).
IELTS Bar Chart Age Groups: Salt Intake (2024)
This writing task 1 bar chart has been adapted from a bar chart that was reported by an IELTS candidate in the IELTS writing task 1 test.
IELTS Bar Chart of Age Groups
Click here to Enlarge Bar Chart Image
IELTS Bar Chart of Age Groups: Model Answer
I’ve underlined language relating to age groups in the model below.
Your Task: Complete the model answer using these linking words: while / as opposed to / then / overall / regarding / furthermore
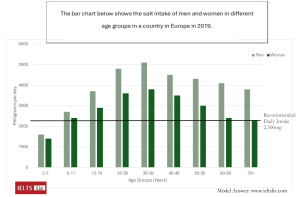
The bar chart illustrates the amount of salt an average man and woman consumed per day (divided into nine age groups) in a European country in 2019. Units are measured in milligrams.
(1)………………, men had a higher intake of salt compared to women and salt intake was above the recommended daily amount in most age groups. (2)………………….., middle aged men and women had the highest intake of salt, (3)………………….. young children who had the lowest. A greater difference in salt intake between the sexes could be seen as men and women aged.
The salt consumed by the youngest age group was just under 2000mg each day for boys but only 1500mg for girls aged five and below. Salt intake (4)…………… increased in both sexes to reach a high of over 5000mg in men and almost 4000mg in women aged 30 to 39.
(5)………………. the 40 to 49 age group, salt intake stood at about 4500mg daily for men, whereas for women it was around 3500mg. This decreased for both genders and by the age of 70 or more, consumption was still relatively high in men (just under 4000mg), (6)……………. women took the recommended daily amount of 2,300mg.
ANSWERS
Click below to reveal the answers to the exercise and the full complete model.
ANSWERS- Overall
- Furthermore
- as opposed to
- then
- Regarding
- while
The bar chart illustrates the amount of salt an average man and woman consumed per day (divided into nine age groups) in a European country in 2019. Units are measured in milligrams.
Overall, men had a higher intake of salt compared to women and salt intake was above the recommended daily amount in most age groups. Furthermore, middle aged men and women had the highest intake of salt, as opposed to young children who had the lowest. A greater difference in salt intake between the sexes could be seen as men and women aged.
The salt consumed by the youngest age group was just under 2000mg each day for boys but only 1500mg for girls aged five and below. Salt intake then increased in both sexes to reach a high of over 5000mg in men and almost 4000mg in women aged 30 to 39.
Regarding the 40 to 49 age group, salt intake stood at about 4500mg daily for men, whereas for women it was around 3500mg. This decreased for both genders and by the age of 70 or more, consumption was still relatively high in men (just under 4000mg), while women took the recommended daily amount of 2,300mg.
(200 words)
Tips & Comments
- The introduction is concise and introduces all key information about the chart, such as categories, divisions, units, country, frequency etc. Introductions are usually just one sentence in writing task 1 reports.
- The overview is separate and contains all key features about highs, lows and any useful comparisons that give a clear overview.
- The body paragraphs contain smaller detail and all sentences are supported by numbers from the chart.
- Rather than giving each individual age group, key points are selected and other groups are referred to as “salt intake increased over the age groups…”. This gives information about other age groups without going into too much detail.
- Always use flexible vocabulary about age: middle aged people/ children aged five and under / young children / as people grew older / the youngest age group / the oldest age group / over the age groups given / people aged 30 to 39 / the 40 to 49 age group / by the age of 70 or more / people between 30 and 39 years of age
- This chart does contain a lot of information which is why the report is 200 words in length. However, most reports will probably be between 170 and 190 words. Longer doesn’t mean better. It just depends on the chart. You do not need to write the word count under your report in your test – I do that just for your benefit.
.
.


The chart demonstrates the amount of salt consumed by males and females of different age brackets in a European country during 2019. The salt was measured in milligrams per day.
Overall, almost all of the age groups exceeded from the recommended daily intake of salt. Men always consumed greater amount of salt compared to women, irrespective of the age. The age group 30-39 had the largest salt intake, whereas the youngest age group consumed the smallest amount.
All the age brackets had surpassed the recommended daily intake of salt which is 2,300mg. The only exception was individuals of age 2-5 (accounting for around 1,400mg women and 1,600mg men).
In the early ages there was a significant increase in the amount of salt consumption. This trend was followed until it reached a peak of 5000mg for male and around 3900mg for female of age 30 to 39.
A reversal in trend was observed in the later years where the salt intake declined significantly. The salt intake of senior citizens (70+) dropped to 2300mg for female and approximately 3800mg of their male counterparts.
Can you give me a band for my essay?
Hello, I have a small question if you don’t mind: can I structure my response as follows?
1. intro
2. overview
3. Body 1: males -> I’ll only write specific amounts (mg) for the youngest, oldest, and middle-aged. other age groups will be generally described with a general trend (e.g., the consumed amounts of salt constantly increase as males’ age increases until the age group (30-39), after which , it starts to gradually fall). i didn’t say any numbers about the teenagers for example, nor the group (60-69) althoug, they were included in my general trend discription.
4. Body 2: females-> the exact same as males, but I will try my best to paraphrase the general trend because the general trend of both sexes is quite identical.
You have to understand why the data is presented in the form that it is. This bar chart. Why? Because bar charts usually are a good way to compare categories. So, one of your main goals will be to comparison. Dividing the body paragraphs into men and women is logical, but it prevents you doing necessary comparisons. A line graph, however, is different – it is trend based and comparisons are not usually needed in the body paragraphs.
One last question: what is the logic behind the paragraphing in your model answer? Is it before middle age and ,,,after?
That’s right. Paragraph division is based on age and within each paragraph, males and females are commpared.
The bar chart displays the daily consumption of salt for males and females of nine age different age groups in a European country in 2019. Units are measured in milligrams.
Overall, with the exception of toddlers and elderly women, both genders exceeded the recommended amount of daily intake across all age groups. In addition, men had a significantly higher salt intake than women across all age groups.
The daily intake of the mineral exceeded the recommended dose in almost all age groups for both genders. The exceptions were children aged 2-5, with an intake of around 1300mgs for both genders, as well as women over the age of 70, who consumed exactly 2300mgs. In addition, women who were above 60 and between 6-11 years had only exceeded the daily intake with around 100mg. However, the salt consumption was the highest among young adults and middle aged groups, peaking at those betwen 30 to 39 years to reach over 5000 in men, and around 3700 in women.
Men generally consumed higher quantities of salt than women, with the biggest difference observed in the over 60 age groups. While women had around 2300mgs per day, men’s intake was around 4100mg for those between 60-69, and 3800 for those over 70. By contrast, younger age groups minimal differences, with around a 200 difference between boys and girls between 2-5 and 6-11 years old.
Hi Liz, can we include recommended daily dose in intro?
Yes, you certainly can.
Can I deal with timeline-based bar charts or age-based bar charts (the ones that have increasing time on the x-axis) like this one as line graphs in the overview? That is to describe the general trends and any main feature, like the peaks of both and the fact that most of the groups surpassed the advised level.
Then, in the body paragraphs, I’ll deal with them as bar charts and make comparisons as you said.
Is that accepted?
Thank you very much for your help; I really appreciate it….
Occasionally you get a bar chart that show change over a period of time (years, months, decades etc). You deal with those the same as a line graph. A bar chart that shows age groups does not show change over time. It compares categories (age groups, hobbies, sports, qualifications etc) between men and women, or between two, three or four countries etc. You tackle them same as any bar chart of comparison. And the overview will contain all key features which will depend on what the chart shows.
Understood
Thank you
Hello, Liz. While I have been taking courses for IELTS in the past two months, I still rely on your lessons, especially in writing. To be honest, I find it difficult to follow certain “rule” from my tutors regarding the structures and the paragraphs. Therefore, your website remains to be my primary subject in learning IELTS writing since it provide a clear explanation without giving any rigid structure. My IELTS course will be ended this week, I hope I am able to get a decent band score by practicing more from your website. Thank you.
The higher band scores need to be approached with a degree of flexibility. This means you understand the marking, the requirements and the limitations, but you have choices. Teachers who give fixed structure and rules do so because it supports people who struggle. But my website is aimed at the higher levels and people at that level need flexibility without a sound understanding. Wishing you lots of luck!!
hello,
Can I say “males reached a peak” instead of repeating “men’s consumption rates reached a peak”?
the context will make it clear
You most definitely want to avoid writing “males reached a peak”. This is about numbers or percentages reaching a peak.
The bar graph shows information about number of people in the UK who are eating five portions of fruit and vegetables every day between 2001 and 2008. The units of measurement that has been used is percentage of people.
Overall, there is a steady increase in percentage of men, women and children who eat enough portions of fruit and vegetables in the first six years and sadly it decreases moderately in the last two years. Women is leading in number when it comes to eating five portions of fruit and vegetables per day through the years meanwhile children have the lowest percentage regarding the said matter.
In 2001 up to 2003, 12.5 % of children eat five portions of vegetable and fruits and it remarkably increase to 25 % in 2007 hence it slightly declined in 2008. Meanwhile women are steadily in 17.5% between 2001 to 2003 and increased steeply in number during 2006 to 2007. On the other hand, men’s percentage is steadily growing during the first six years with the highest percentage of over 30 then it gradually declined in the year 2007 to 2008.
I don’t think subjective words such as ‘sadly’ should be used in the objective writing 1 task. also the % sign should be attached to the number. 100% enjoyed your answer otherwise.
Hi Liz!
I would like to know if the numbers are also counted as a word in writing tasks.
Yes, they are. The word count works precisely the same way that it works when you write in a Word Doc. Each individual item (word or number) is counted.
Can I use ‘compares’ word instead of using the words like ‘illustrates’, ‘shows’ etc in an introduction paragraph for any bar graph?
Is it right to use this word?
If you are spending your time trying to improve a band score 9 appropriate word, then you aren’t using your time well. Don’t change things that don’t need changing. Success in IELTS is about staying focused on what really matters and what really alters your score.
Hey liz is it okay to write
The bar chart illustrates how much salt consumed on a daily basis by men and women in different age groups in an European country in 2019. Units are measured in milligrams.
So is it correct to write how much salt consumed or is consumed and is it okay to write : on a daily basis?? Love from Minna🕊️
“on a daily basis” is fine.
“how salt salt consumed” – should be “is consumed”
Here we go……
This bar chart exhibits the quantity of salt which was consumed by both genders on a daily basis within nine (various) age categories in an unspecified European country in 2019. Units are given in milligrams.
Overall, it can be seen that except children who were aged between 2 and 5 years, all the other age groups successfully met the advised daily intake criteria of 2,300 mg of salt. Moreover, males were the predominant consumers of salt regardless of the age group they belonged to.
Regarding women, the largest usage of salt was noticed in three age categories, altogether from 20 to 49 years, with figures somewhere around 3,500 mg. Furthermore, females who were in the age groups of 12 to 19 years and 50 to 59 years, ingested somewhat identical quantities of table salt. The former with a number of slightly under 3,000 mg, whilst the latter had precisely 3,000 mg.
In contrast, there were five age categories of males taken together, between 20 and 60 years of age, who managed to consume a dazzling quantity of sodium chloride, which exceeded 4,000 mg a day. That is nearly twice of the suggested daily intake. Meanwhile, youngsters that were aged from 12 to 19 years and gentlemen who were above 70 years, used approximately the same amount of salt, just below 4,000 mg.
The bar chart illustrates the consumption of salt by nine different age groups of male and female per day in an European country in 2019. Units are measured in milligrams.
Overall, male from all age groups consumed more salt than women. While middle aged people taken highest amount of salt, preschoolers consumed lowest amount of salt. The greatest difference in intake between the gender shown in most eldest two age groups.
There was a difference between the boys and girls of about a thousand in both 2-5 years and 6-11 years with more boys consumed around 1600 and 2700 mg salt respectively. However, adolescent (12-19) boys consumed around 3800 mg, compared to girls’ intake of just below 3000mg.
In terms of young and midddle aged men (20-29 and 30-39), consumed approximately 5000 mg, as opposed to women around 3600 mg. Over 4000 mg was consumed by 40-49 and 50-59 years of age men, compared to women taking around 3500 and 3000 mg respectively. Furthermore, A highest difference of about 2000 mg between men and women was evident in 60-69 and 70+ age groups, where women in both groups consumed around 2300 mg.
dear Liz…I know you do not comment on writing, however, is my technique correct??
The graph illustrates the information and predictions of the change in percentage of the population aged 65 and above in three countries (Canada, Germany and UK) in three different years (1988, 2000 and 2030).
In general, there is a rise in trends of aged population over years in all three countries. In addition, Germany have the higher percentage of population of aged 65 and above in given time periods, reaching one third of the population until 2030.
In 1998, UK and Canada had about 14 and 16 percentage of population aged more than 64 respectively, as opposed to Germany had around one fifth (20.45%) of the population. The aged population proportion was rose by about 5 percentage in Canada and Germany accordingly, while UK was remained nearly unchanged slightly less than 15 percentage.
In the future prediction, there is a considerable rise around 5 percentage in all countries until the 2030. At the end of given period, the order of aged population of 65 and above will be about one fifth in UK, more than one fourth in Canada and slightly less than one third of the population in Germany.
Thanks so much this is really helpful
I’m glad it was useful 🙂
I just wanted to say a massive thank you for all the awesome stuff you’ve been sharing on your blog about IELTS prep. Seriously, your tips and lessons have been a game-changer for me! Thank you so much!!!!
You’re welcome. I’m glad you are enjoying my website 🙂
Liza good teaching
I’m glad it was useful 🙂
According to, while on the other dramatically, then , overall.
1.Overall
2.Moreover
3.As opposed to
4.Gradually
5.With regards to
6.while
1.Overall
2.Moreove
3.As opposed to
4.Gradually
5.With regards to
6.while
1.Overall
2.Moreove
3.As opposed to
4.Gradually
5.With regards to
6.while
1. Overall
2. Furthermore
3. As Opposed to
4. Then
5. Regarding
6. While
1.Overall
2. Furthermore
3. Opposed to
4. Then
5.Regarding
6. While
1.overall
2.furthermore
3.while
4.then
5.regarding
6.as opposed to
overall
furthermore
while
then
as opposed to
regarding
1. Overall
2. Furthermore
3. While
4. Then
5. Regarding
6. Opposed
1= overall
2=while
3=as opposed to
4=then
5=regarding
6=furthermore
overall, as ,oppose to ,then ,furthermore , while
1. Overall
2. Furthermore
3. as opposed to
4. then
5. regarding
6. while
1. Overall.
2. Furthermore.
3. As opposed to.
4. Then.
5. Regarding.
6. While
1. Overall
2. Furthermore
3. As opposed to
4. Then
5. Regarding
6. While
1. Overall
2.furthermore
3. while
4.then
5. regarding to
6. as opposed to
overall
while
opposed to
as
furthermore
then
1 Overall
2While
3Then
4Furthermore
5Regarding
6Overall
1. Overall
2. Furthermore
3. As opposed to
4. Then
5. regarding
6. While
The bar chart illustrates the daily average salt consumption in milligrams (mg) for men and women in various age groups within a European country in 2019. The recommended daily intake is also highlighted.
Overall, men consistently consumed more salt than women across all age groups, and salt intake exceeded the recommended amount for most of the population. Children under five years old had the lowest intake, with boys averaging around 2,000mg and girls around 1,500mg. Salt consumption then rose sharply in both genders, reaching a peak for men aged 30-39 at over 5,000mg and nearly 4,000mg for women in the same age group. There was a slight decline for both genders in the 40-49 age range, but intake remained well above recommended levels. After the age of 50, men’s consumption continued to be higher than women’s, although it gradually decreased towards the recommended daily intake of 2,300mg. Women aged 70 and over were the only group to meet the recommended daily intake.
In conclusion, the data suggests that a significant proportion of the population in this European country consumes excessive amounts of salt, with men and middle-aged adults being the most likely to exceed recommended guidelines.
1) Overall
2) Furthermore
3) As opposed to
4) Then
5) Regarding
6) While
1) Overall
2) Furthermore
3)As opposed to
4)Then
5) Regarding
6) while
1.Overall
2.While
3.Opposed to
4.furthermore
5.regarding
6.as
Correct me, if any mistake
1. Overall
2. Furthermore
3. As opposed to
4. Then
5. Regarding
6. While
1.Overall
2.further more
3.On the other hand/ while
4.then
5.regarding
6.while
Overall
Furthermore
as opposed to
then
Regarding
while
1)Overall
2)Furthemore
3)as opposed to
4)then
5) Regarding
6) while
1.Overall, 2.On the other hand, 3.While, 4.dramatically, 5.According to, 6.then.