An IELTS bar chart and model answer which shows change over time. The IELTS bar chart below was reported in IELTS writing task 1 (Academic) and is likely to be repeated in following years. I’ve created a model answer lesson which has a useful language focus for you.
While this task 1 is in bar chart form, it actually shows change over time which means you will be also using language that is typically used for describing line graphs. It is different from the usual bar charts you see in IELTS which show comparisons of categories. This means it is more similar to a line graph than a normal bar chart. For this reason, I like to call such bar charts: bar charts of change over time. These types of bar charts do appear in IELTS writing task 1 quite regularly so look out for them.
IELTS Bar Chart Change over Time
Note that the chart depicted above was sent to me from an IELTS candidate.
Model Answer Bar Chart
Instructions: Fill in the model answer using the language options presented below:
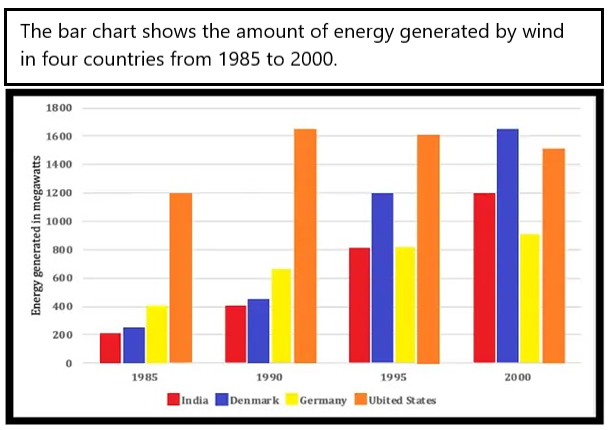
The bar chart illustrates how much energy was produced by wind in four countries (India, Denmark, Germany and the United States) in four years (1985, 1990, 1995 and 2000). Units are measured in megawatts.
Overall, the US produced the most wind energy over the period given except in the final year when Denmark produced the most. India, Denmark and Germany witnessed 1) ……….. over the years in the amount of energy they generated, whereas the US showed 2) ………. followed by a slight decline.
In terms of the US, energy production stood at 1200 megawatts in 1985. It peaked in 1990 at just over 1600 before 3) ……….. around 100 to 1500 in the final year.
On the other hand, the energy generated in Denmark was just over 200 megawatts in 1985 and then 4) …………. over the years 5) ………… just over 1600 in 2000. India also saw 6) …………. in energy generation, starting at 200 and ending at 1200. Lastly, Germany saw 7) ………….. , only doubling over the period to reach just over 800.
Fill in the gaps with the following words:
- A. a significant rise
- B. falling by
- C. to peak at
- D. a steady climb
- E. a much lower growth rate
- F. an initial increase
- G. rose almost eight-fold
ANSWERS
Click below to show the answers:
ANSWERSAnswers:
- D
- This refers to all three countries (Denmark, India and Germany). Some countries had significant increases but not all. So, using the word “steady increase” is a better description to use for all three.
- Having D in this gap will then allow the use of “a significant rise (A) for gap number 6 which relates to India only, which definitely was significant in energy growth.
- F
- We can see that the only country with a growth rate that happened only in the first year was the US.
- The answer can’t be G because an eight-fold rise means it grew from, for example, 100 to 800 (8 times in growth) – this isn’t true.
- The answer can’t be D because the word “steady” refers to an even rise over a period of time as shown in the chart – the chart only shows a rise from one single column to the next, not over all columns.
- It can’t be E because the growth rate wasn’t slower than other countries at the time.
- B
- Nearly all of you got this right. Well done!
- G
- Most of you got this one right too. Well done!
- The answer can’t be A because it would be incorrect grammar. The sentence is “the energy generated was X number and then …..”. This gap requires a verb to follow the word “and”.
- C
- Most of you got this right. Well done!
- The final year for Denmark is significant because it is a special peak in the whole chart. Nearly all charts showing change over time will have one special peak that you should mention.
- A
- This rise is significant. We can also say “considerable”. It rose from 200 to 1200 – that’s a huge rise.
- Certain we could describe this as a steady rise (D) because it was consistent in growth over the period. But this doesn’t highlight how big the rise was which is the main point and also, we used option D already. So, the answer must be A.
- E
- Most of you got this right. Well done !
- This final paragraph is about Demark, India and Germany. From those three countries, Germany definitely showed the slowest growth rate over the period.
Don’t use this model answer only as a gap fill exercise. Notice the structure, organisation and content of paragraphs. Notice the grammar used. Notice the paraphrasing used.
The bar chart illustrates how much energy was produced by wind in four countries (India, Denmark, Germany and the United States) in four years (1985, 1990, 1995 and 2000). Units are measured in megawatts.
Overall, the US produced the most wind energy over the period given except in the final year when Denmark produced the most. India, Denmark and Germany witnessed a steady climb over the years in the amount of energy they generated, whereas the US showed an initial increase followed by a slight decline.
In terms of the US, energy production stood at 1200 megawatts in 1985. It peaked in 1990 at just over 1600 before falling by around 100 to 1500 in the final year.
On the other hand, the energy generated in Denmark was just over 200 megawatts in 1985 and then rose almost eight-fold over the years to peak at just over 1600 in 2000. India also saw a significant rise in energy generation, starting at 200 and ending at 1200. Lastly, Germany saw a much lower growth rate only doubling over the period to reach just over 800.
.
I hope you found this lesson useful, Liz
……………………………………………………………….
.


Hi, Liz! Thanks for the essay!
I usually tend to compare different categories following the change of time, so I categorised the years 1985 and 1990 in the 1st para, and 1995 and 2000 in the 2nd para. And then I compared different numbers and changes in these countries. May I ask is that OK?
There is no black and white rule. It depends how easy the information is to follow. You are marked on your ability to be logical but also on information being easy to follow without repetition. Organisation should also support the type of task given. For example, bar charts which show categories to compare, should be organised to compare. Graphs that show change over time usually show trends. Each line has a unique trend so organisation should highlight those trends, which is why for line graphs it is sensible to review each line separately. This type of chart does have any specific best organisation and will depend on the trends shown. And of course, whichever organisation you use, your writing not exceed 210 words at any time, even hitting 200 words is considered a lot.
Good to know, thank you!
Why isn’t Megawatts mentioned after every number?
That units are megawatts is introduced in the introduction. It is also mentioned again in each passage to remind the reader of the type of units. Therefore, when it’s a long word like “megawatts” it’s ok not to repeat it again and again. It is implied instead.
The bar chart illustrates how much energy did India, Denmark, Germany and the United States generate using the wind mill between 1985 and 2000. Units are measured in megawatts.
Overall, the maximum energy was generated by the United States throughout the given period except in the final year when Denmark exceeded the US. All the countries saw a gradual rise in their power generation except the US which decreased after 1990.
India was the least generator of energy using wind for the first 2 given years having produced only 200 and 400 megawatts respectively. Meanwhile Germany was producing about twice of India in the first year and 600 megawatts in the second year. By 1995, India doubled than its previous number to match equally with Germany (800 megawatts) , before rising to 1200 megawatts in 2000, exceeding Germany by a differnce of 300.
Denmark also climbed steadily from 200 megawatts in 1985 to just above 1600 megawatts, becoming the highest producer in 2000. On the other hand, in the first year, it was the US who produced a huge amount of 1200 megawatts energy, which was drastically higher than any other countries at that time. It increased to reach a peak of just above 1600 in 1990, before gradually dropping to 1500 by the end, having lost its place to Denmark.
The information regarding the amount of energy produced by wind in four countries from the year 1985 to 2000 is illustrated by a bar graph. The data has been calibrated in megawatts.
Overall, it is ostensible from the graph that the maximum energy was generated by America in the given three years, except the year 2000. while, the complete opposite is true for India in 1985 and 1990.
To begin with, India produced about 200 megawatts of energy through their wind. Followed by this, Denmark generates a little over 200 megawatts of energy in the year 1985. Power produced by United States was exactly 1,200 megawatts in the same year. Moreover, in the subsequent year, United States reaches it’s peak value of 1,650 megawatts in terms of producing energy. Germany, in 1990, was accounted with 650 megawatts of energy, that was 1,000 megawatt less than the energy conducted by America.
Probing further, the value of energy generated by India in 1995 inclined by 400 megawatts, similar to India, Germany as well encounters the exact value of power conducted through wind in the same year. Additionally, the country of Denmark escalated in terms of generating power through wind with the amount of 1,650 megawatts which was same as America, recorded in 1990. However, the United States of America drops to a value of 1,500 from 1,600 megawatts in the year 2000.
Don’t forget that the overview is the most important paragraph in your task 1. You need to expand it to include more key features if you want a good score. Also try to avoid phrases that are padding, such as “probing further” (this is unsuitable for task 1) and “it is ostensible from the graph that” (unnecessary padding).
The given chart illustrates information about the amount of energy which is generated by wind forces in four different countries between 1985 and 2000, the measured value is represented by megawatts.
Examining the chart briefly shows that using wind power as a source of energy increased during this period and the greatest change for using this energy source is for Denmark which shows a 800 percent increase in using wind power.
At the beginning of the period the only country that uses wind turbines more than 400 megawatts is USA which produces about 1200 megawatts power in 1985 also it is clear that the only country which reduced the amount of power made by wind at the end of period is USA again which steadily decreased from more than 1600 MeW at 1990 to 1500 Mew at 2000.
Other countries increased their power energy plants like Denmark despite this fact Germany lost its rank position from being the second country which uses most wind power in 1985 by 400 MeW to the forth position in 2000 by almost making that amount double in 2000.
Let me first extend my heartfelt wishes for your early recovery. With trembling hands ( as I respect you a lot and can’t imagine to contradict you in my wildest dreams) I just wanted a small clarification regarding the explanation you gave in the final answer, where you said Denmark had shown lowest growth; and India’s increase as significant (you stated earlier). What I can see, Denmark’s growth is as considerable as any other country, except the US.
with profound regards.
I think you’ve misread the answers. The term “a much lower growth rate” was used to describe Germany, not Denmark. Take a look again.
The given chart illustrates 15-year wind energy production of India, Denmark, Germany and the United States. The given data dates from the year 1985 to 2000.
Overall, wind energy generation has an upward trend, with all four countries increasing their production from 1985 to 2000. India and Denmark have drastically increased their production. Germany also gradually increased their wind energy generation. While, the United States remained consistent with its making, falling by only a small margin of megawatts over the 15-year period.
India started off by generating only 200 megawatts of wind energy. They significantly expanded the industry. By the year 2000, they were producing 1200 megawatts. Denmark followed similar footsteps as India and became the highest producer of wind power among the four countries in these 15 years. They increased their wind energy production to more than 1600 megawatts in year 2000 as compared to producing only about 200 megawatts in year 1985, showcasing a dramatic 700% growth.
Germany also showed consistent growth starting from 400 megawatts and reaching to more than 800 megawatts in these 15 years. Lastly, the United States has been a consistent wind power production leader and came second in the 15-year period. It started off with 1200 megawatts, which increased to more than 1600 megawatts in the year 1990. However, after 1990, wind energy production fell in the States by a few hundred units only.
D
F
B
G
A
D
E
Hi,
Could you please tell me, what does mean “saw” in the last paragraphs?
Best regards
This is the same as using the word witnessed: “The UK witnessed a rise in unemployment this year.”
Hi Liz,
Thank you
Best wishes
thanks for sharing. You are an amazing teacher who yarns to see the success of your student. God richly bless you more and more
I’m glad you found it useful 🙂
Thanks Liz. My exam on academic module is on the 17th October. I will revise this model answer on night before. The way you describe charts is so easy and confidence boosting. Love you. I am your big fan.
Love from Bangladesh
Good luck in your test!! 🙂
Thank you, Liz for the follow-up answers as promised and their explanations.
You’re welcome 🙂
Thank you for the very useful lesson.
You’re welcome 🙂
1)D
2)G
3)B
4)A
5)C
6)F
7)E
1. D
2. A
3. B
4. G
5. C
6. F
7. E
1.D
2.A
3.B
4.G
5.C
6.E
7.F
1 E
2 A
3 B
4 F
5 C
6 D
7 G
1.D
2.A
3.B
4.G
5.C
6.E
7.F
1- A
2-D
3-B
4-G
5-C
6-F
7-E
1)D
2)F
3)B
4)G
5)C
6)A
7)E
1.c
2.e
3.b
4.a
5.g
6.f
7.d
D , F , B, G, C, A, E
1.D
2.G
3.C
4.A
5.F
6.E
7.B
Rifat Latif
October 11,2023 at
1)E
2)D
3)B
4)G
5)C
6)A
7)F
D
B
C
G
F
A
E
1) E
2)D
3)B
4)G
5)C
6)A
7)F
I have noticed lately that you are sick, I’m sorry for that, and I wish you sooner recovery and I pray for your good health. May God Almighty heal you now! I want to see you in good health. Stay blessed.
Thanks for your kind message
1. D
2. F
3. B
4. G
5. C
6. A
7. E
D,F,B,G,C,A,E
1.D
2.A
3.B
4.G
5.C
6.E
7.F
1.E
2.A
3.B
4.G
5.C
6.F
7.D
1. D
2.A
3. B
4.G
5.c
6.F
7.E
1) D
2) A
3) B
4) F
5) C
6) G
7) E
D
F
B
G
C
A
E
1) E
2) D
3) B
4) G
5) C
6) A
7) F
1. D
2. A
3. B
4. G
5. C
6. F
7. E
1. D
2. F
3. B
4. A
5. C
6. E
7. G
Lawal Dare Tosin
1: E
2: A
3: B
4: G
5: C
6: D
7: F
1.E
2.D
3.B
4.G
5.C
6.A
7.E
1. D
2. F
3. B
4. G
5. C
6. A
7. E
1.D
2.F
3.B
4.G
5.C
6.A
7.E
1.D
2.F
3.B
4.G
5.C
6.A
7.E
1)D
2)F
3.B
4.G
5.C
6.A
7.E
1) D
2) F
3) B
4) G
5) C
6) A
7) E
1.D
2.A
3.B
4.G
5.c
6.D
7.D
Answers:
1. D
2. F
3. B
4. G
5. C
6. A
7. E
1. A much lower growth
2. Significant rise
3. Falling by
4. Rose almost eight fold
5.To peak
6. A steady climb
7. An initial increase
1.A
2.D
3.B
4.G
5.C
6.F
7.E
1 d
2c
3b
⁴f
5a
6d
⁷e
D,C,B,A,G,E,F
D, F,B,G, C, A, E
1 D
2 A
3 B
4 G
5 C
6 E
7 F
1. a steady climb
2. an initial increase
3. falling by
4. rose almost eight-fold
5. to peak at
6. a significant rise
7. a much lower growth rate
D,F, B, A, C, G, E
1.E
2.D
3.B
4.A
5.C
6.F
7.G
1 D
2 F
3 B
4 G
5 C
6 A
7 E
The bar chart illustrates how much energy was produced by wind in four countries ( India, Denmark, Germany and the United States) in four years ( 1985, 1990, 1995 and 2000). Units are measured in megawatts.
overall, the US produced the most wind energy over the period given except in the final year when Denmark produced the most . India, Denmark and Germany witnessed a steady climb over the years in the amount of energy they generated whereas the US showed a significant rise followed by a slight decline.
In terms of the US, energy production stood at 1200megawatts in 1985. It peaked in 1990 at just over 1600 before falling by 100 to 1500 in the final year.
On the other hand, the energy generated in Denmark was just over 200 megawatts in 1985 and then rose almost eight fold over the years to peak at just over 1600 in 2000. India also saw a steady climb in energy generation, starting at 200 and ending at 1200.
Lastly, Germany saw a much lower growth rate, only doubling over the period to reach just over 800.
i’m not for academic,for GT. Even after that i replied just to check my self.
Ans. for
1)C
2)E
3)B
4)A
5)G
6)F
7)D
I love your attitude. It’s true that GT candidates only need to write a letter for writing task 1, but it’s great to learn more anyway. Learning is a positive, enjoyable thing to have in your life. Hats off to you !! 🙂
1. D
2. F
3. B
4. G
5. C
6. A
7. E
1, D
2, A
3, B
4,. D
5. A
6. D
7. F
1-a steady climb
2-an initial increase
3-falling by
4- rose almost eight-fold
5-to peak at
6-a significant rise
7- a much lower growth rate
I find your teachings helpful as I read them in preparation for my exams.
a much lower growth
1 – D
2 – F
3 – B
4 – G
5 – C
6 – A
7 – E
I love your method of teaching and will like to pass my ielts at one sitting.
It’s my pleasure I get to know you through this medium. I will utilise it effectively.
Answers
1. D
2. A
3. B
4. C
5. G
6. E
7. F
1. e
2. g
3. b
4. f
5. d
6. a
7. c
thanks
mode answer for 2023 bar chart
1- F (an initial increase)
2 -A (a significant rise)
3 -B (falling by)
4 -G (rose almost eight fold)
5 – C (to peak at)
6 -D (a steady climb)
7 -E (a much lower growth rate,)
1 D
2 A
3 B
4 G
5 C
6 E
7 D
1) a steady climb
2) an intial increase
3) a steady climb
4) rose almost eight fold
5) to peak at
6) a significant rise
7) A steady climb
1 d
2 a
3 b
4 g
5 c
6 f
7 e
1D2E3B4G5C6A7F
Thanks for your comment
1. A
2. F
3. B
4. G
5. C
6. D
7. E
1. A
2. F
3. B
4. G
5. C
6. D
7.E
1.D
2.A
3.B
4.G
5.C
6.E
7.F
1. An initial increase
2. A steady climb
3. Falling by
4. Rose almost 8 folds
5. To peak at
6. A significant rise
7. A much lower growth rate
1- D
2-A
3-B
4-G
5-C
6-F
7-E
This is very helpful luz.
Thank you for everything.
1) A
2) F
3) B
4) G
5) C
6) D
7) E
D,F,B,G,C,A,E
1) D
2) F
3) B
4) G
5) C
6) D
7) E
1)D
2)F
3)B
4)A
5)C
6)g
7)e
D
B
C
G
F
A
E