Creating a Model Answer for IELTS writing task 1.
Many students asked me to write a full model answer for this bar chart which was used in my lessons last week.
IELTS Complex Bar Chart
Source of Bar Chart: https://www.english-in-chester.co.uk
IELTS Bar Chart Model: Sentence Ordering
Put the 10 sentences below in order to make a full band 9 model answer for IELTS writing task 1.
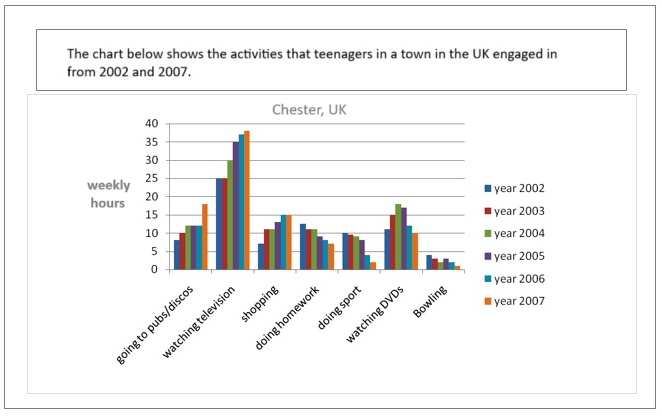
- A) Teenagers spent 25 hours on watching television in 2002 which increased to almost 40 hours in the final year.
- B) The other pursuits showed a decrease in hours, except watching DVDs which fluctuated.
- C) Going to pubs or discos, watching TV, and shopping all showed an increase in the number of hours teenagers spent on these activities.
- D) The bar chart illustrates how many hours adolescents in Chester spent on seven activities each week between 2002 and 2007.
- E) While teenagers occupied 10 hours doing homework in 2002, this figure dropped to just over 5 in 2007.
- F) The number of hours teenagers dedicated to watching DVDs was only 10 hours in first and final years, but reached a peak of over 15 hours in 2004 and 2005.
- G) Overall, the most popular activity over the period given was watching TV, whereas bowling was the least favourite.
- H) Bowling was under 5 hours throughout the entire period (declining by about 4 hours in total).
- I) Both going to pubs or discos, and shopping more than doubled in hours from over 5 to around 15 or slightly above.
- J) Playing sport fell more dramatically from 10 hours to around 3 hours.
Notice how many sentences are used to create a full model answer. IELTS writing task 1 does not require many sentences. There are NO fixed number of sentences for writing task 1, but you can see that you do not need many to write a high score answer.
Answers
Answers are now available. Please remember the answers also contain the full model answer in the right order. This isn’t just a lesson to complete an exercise, it is a method of helping you understand model answers and to learn from them. Take your time to review your answers and also review the full model.
Click below for the Answers
AnswersD, G, C, B, A, I, E, J, H, F
The bar chart illustrates how many hours adolescents in Chester spent on seven activities each week between 2002 and 2007.
Overall, the most popular activity over the period given was watching TV, whereas bowling was the least favourite. Going to pubs or discos, watching TV, and shopping all showed an increase in the number of hours teenagers spent on these activities. The other pursuits showed a decrease in hours, except watching DVDs which fluctuated.
Teenagers spent 25 hours on watching television in 2002 which increased to almost 40 hours in the final year. Both going to pubs and discos, and shopping more than doubled in hours from over 5 to 15 or slightly above.
While teenagers occupied 10 hours doing homework in 2002, this figure dropped to just over 5 in 2007. Playing sport fell more dramatically from 10 hours to around 3 hours. Bowling was under 5 hours throughout the entire period declining by about 4 hours in total. The number of hours teenagers dedicated to watching DVDs was only 10 hours in first and final years, but reached a peak of over 15 hours in 2004 and 2005.
Word count = 194 (you do not need to write the word count in your test)
Paragraphing Tips
- It is possible that the last sentence about DVDs could be written as a separate paragraph.
- Always have an introduction and overview. They must be separate statements.
- Always divide your body paragraphs into two (or sometimes three) paragraphs.
- Your body paragraphs should be logical and help to highlight similarities and differences.
- Learn an empty line between paragraphs to make them clear and easy to see. This is not a requirements, it is a recommendation. If your paragraphs are not easy to see, your score might be lower.
.
All the best, Liz
Recommended for You
ALL MODEL ANSWERS & TIPS FOR WRITING TASK 1
……………………………….


I want to ask that do the years and the activities need to be in a chronological order or i can write them ranking by the highest to lowest
It’s always best when writing reports to keep logical order which means following the order it is presented in the chart or table.
The diagram provides information about the hours per week that teens spent doing diverse activities (clubing, watching TV, shopping, doing homework, playing sports, watching DVDs and bowling) in the years from 2002 to 2007 in Chester.
Overall, by a huge difference, teens between those years have being spending most of their time watching TV, whereas bowling was the activity less chosen by the analysed population. More specific, 2007 was the year in which teens consumed a vast amount of hours on TV (around 40 hours per week) and less on bowling (not even 5 hours).
In addition, clubbing, watching TV and shopping had a graduate increase, but doing homework, playing sports and bowling did not run the same luck. Also, watching DVDs fluctuated.
All in all, teens during 2002 and 2007 in Chester chose to spend more time watching TV and did not included as much bowling in their daily life.
(words counting: 151)
The chart illustrates the amount of time spent by teenagers doing some activities (discos, watching television, shopping, doing homework, doing sport, watching DVDs, bowling) each week in 7 years from 2002 to 2007. Units are measured in hours per week.
Overall, it can be seen that amount of time spent to watch television is highest as oppose to bowling which is the least in the period given. The trend of the amount of time spending steadily rose for going to pubs/discos (around 8 to 16), watching television (exact 25 to over 35) and shopping (around 6 to 15). In contrast, the trend of the amount of time spent for doing homework (around 12 to 7), doing sport (10 to below 3) and bowling (which was already at least gradually fall from relatively close to 4 to 1).
Furthermore, the trend of the amount of time spent for watching DVDs was gradually increase (over 10 to around 16) from 2002 to 2004, then start falling (around 16 to exact 10) till 2007.
To learn more about paragraphing, go to the main writing task 1 section of this page: https://ieltsliz.com/ielts-writing-task-1-lessons-and-tips/
The bar chart represents the activities namely – going to pubs/disco, watching television, shopping, doing homework, doing sport, watching DVDs and bowling- the teenagers in Chester spend their time on throughout the week, specifically in the years 2002 to 2007.
Noticeably, the most popular activity throughout the five year period, has been watching television. While, the least popular has been bowling. On one hand, Going to pubs/ disco, watching television and shopping have all seen a steady growth when it came to the time spent on them. On the other hand, doing homework, and sports have been in decline with the passing years. While watching DVDs and bowling, experienced some fluctuations.
Pubs/ Disco although not as popular, were dedicated almost 10 hours a week by the teenagers of Chester in 2002. The following years saw an increase in their popularity, reaching over 10 hours by 2004. This number then became steady for the next three year until a sudden peak in 2007, reaching almost 20 hours a week. In contrast, watching television was the most popular at 25 hours a week in 2002. This number stayed the same in 2003, followed by a 5 hour gain in 2004 and 2005 respectively, and by 2007 it had reached more than 35 hours a week, still maintaining itself as the highest.
Shopping was considered mildly popular, starting at just over 5 hours in 2002. Although it gained steady popularity in the following years, reaching a little over 10 hours in 2003 and 2004, and finally 15 hours in 2006 and 2007. In contrast, doing homework and sports, saw a decline in the number of hours spent on them. While the decrease was slower with homework, going from almost 15 hours in 2002 to a little over 10 hours in 2003, and then all the way down to just over 5 hours by 2007. Doing homework saw a steep fall, starting at ten hours in 2002 and going down to almost 1-2 hours by 2007.
Watching DVDs had the highest fluctuations, with a steady growth starting from over 10 hours in 2002, peaking at just under 20 hours in 2004, and sloping back down to 10 hours by 2007. Lastly, bowling which has considerably been the least popular of the seven at just under 5 hours, slightly decreased and increased along the way, until it reached just about an hour by 2007.
Read about word count on this page: https://ieltsliz.com/ielts-writing-task-1-lessons-and-tips/ and also review all tips and model answers. Writing too much or too little can really impact your score.
The chart illustrates the number of hours per week that youngsters spend doing seven specific activities in hamster in five years from 2002 to 2007.
Overall, watching tv remained the most popular activity throughout these seven years while bowling remained the least popular activity with a slight decrease over the years.
Teenagers spent most of the time watching tv starting from 25 hours a week in 2002 and reaching to almost 45 hours a week in 2007. Going to pubs also became popular over the years as the average hours reached to almost 17 hours in 2007 starting from only about 7 hours in 2001. The average hours for shopping almost doubled as it reached to almost 15 hours per week in 2007 starting from only around 7 hours a week in 2002.
Bowling remained the least favourite activity with average weekly hours declining from four to one hour in 2002 to 2007 respectively. Sports activities witnessed a drastic decline as average weekly hours reached to almost two hours in 2007 from roughly ten hours per week in 2002. Time spent on doing homework fell from almost thirteen hours a week to around seven hours a week in five years. Watching DVD was becoming popular till 2004 and reached to around seventeen hours and then declined to less than ten hours in 2007.
The bar chart is comparing the amount of time teenagers in Chester do different activities such as going to discos, shopping, watching TV, doing homework and etc. between 2002 and 2007.
Overall, it is obviously illustrated that watching TV was their whole times favorite since it was constantly the first time-consuming activity whilst going bowling was the last choice for all the period long.
Watching TV was in a specific amount for the first two years before in opt a dramatic rose from2004 until 2007. Going to clubs was about 7 and a half hour in 2002 and it remains at the level of almost 12 hours for 3 years before it reached nearly 18hours per week in 2007.
In terms of bowling, it experienced a constant decreasing and it drops from about 5 hours per week to almost nothing in2007. The other leisure time habit which showed some fluctuations is watching DVDs that reach a peak from 2002 to 2004 to meet the highest point in 2004 and then showed a downward trend until 2007 that it hit the least point of 10 hours.
Watch this video to improve your introduction paragraph: https://ieltsliz.com/introduction-paragraph-for-ielts-writing-task-1-reports/
The bar chart illustrates the number of hours that adolescents spent on seven different activities (going to pubs/ discos, watching TV, shopping, doing homework, doing sport, watching DVDs and bowling) each week over a 6-year period from 2002 to 2007 in Chester.
Overall, watching TV was the most popular activity among teenagers during the period given in Chester, compared to bowling which was the least. The weekly hours spent on going to pubs/ discos, shopping increased from 2002 to 2007, while for the other activities, it was the opposite, Except for watching DVDs, which fluctuated.
Watching TV started at just 25 hours in 2002 and reached a peak of approximately 37 hours in 2007, which showing the high level of interest in this activity among teenagers, While other pursuits remained under 20 hours during the period given.
Although going to pubs/discos, watching TV, and shopping all showed an increase in the number of hours spent on them by teenagers, watching TV was the only pursuit on which adolescents spent more than 20 hours per week. In terms of other activities, except for going to pubs and discos, which reached a peak of about 18 hours in 2007, and watching DVDs, which reached approximately 17 hours in 2004 and 18 hours in 2005, the number of weekly hours spent on others remained under 15 hours.
The bar chart below presents how much time per week that teenagers spend to their certain chores in Chester city during 2002 to 2007. Furthermore, these activities include bowling, watching dvd, doing sport, shopping, watching tv and going to pubs.
Overall, these bars illustrate these nations spent at least 35 hours per week watching television programs in 2007, on the contrary teenagers played bowling for less than 5 hours. Additionally watching tv takes more time in their life during 5 years. Moreover, they spend less than 15 hours per week doing home assignments.
The most significant subject is that their enthusiasm to going to pubs increased especially in 2007 reaching out to more than 15 hours.
To clarify the diagram, despite all 7 activities are vital for their life, but they couldn’t pay attention enough to doing sports by spending more times for visiting markets and buying staff instead of going gym. {please give score}
you should eliminate below word as they can not see the graph
The bar chart illustrates the duration of time teenagers spend on activities including watching Television, going to pubs, doing assignments, going bowling, and doing sports for 5 years(2002 till 2007).
overall, the bar chart shows that watching Television has been prevalent over the last five years in contrast, bowling was less popular among teenagers in the following years(2002 to 2007).
watching TV among adults slightly increased from 25 to 37 hours between 2004 and 2007 and reached its peak. in addition, implementing homework among teenagers slowly decreased by about 10 to 5 in the following period. teenagers spend their time going to pubs that slightly increased from 5 to 15 hours in 2002 and 2007.
From 2002 to 2007, exercise among the young generation went down about 10 to 2 hours. furthermore, from 2002 to 2004, watching DVDs among young people slowly increased from 5 to 15 but from 2004 till 2007, it slowly decreased among teenagers.
The bar graph illustrates the weekly hours that teenagers in Chester spent on various activities over a 5-year period from 2002 to 2007.
Overall, it is evident that watching television remained the most popular activity, while bowling consistently had the lowest engagement. Additionally there was a notable increase in the time teenagers spent going to pubs and shopping, whereas other activities showed a decline, except for watching dvds, which fluctuated over the years.
In 2002, teenagers spent approximately 8 hours per week going to pubs, a figure that steadily increased to a peak of around 18 hours in 2007. The time allocated to watching television and shopping by teenagers climbed gradually, from 25 to nearly 40 hours and from below 7 to 15 hours per week, respectively.
On the other hand, bowling displayed a fluctuating pattern, peaking at 8 hours in 2004.
Activities such as doing homework, doing sports and bowling showed a decline over time. Homework hours decreased from about 12 hours in 2002 to 7 hours in 2007. Similarly, the time spent on sports decreased from 10 hours in 2002 to around 2 hours in 2007. Bowling remained the least favourite activity, standing at 1 hour per week in the final year.
A little longer than needed
The bar graph depicts the amount of time in a week that teenagers spend doing specific activities in Chester between 2002 and 2007.
Overall, the number of teenagers who watched television remains the highest throughout the period. Bowling was the least favourite activity done by teenagers in 2007.
There was a fair amount of increase in hours spent going to pubs or discos from approximately 7 percent in 2002 to around 11 percent in 2004, where it plateaued before making a dramatic increase in 2007, just below 20 percent among teenagers. Despite the steady value between the years 2002 and 2003 for watching television, the number of hours spent by teenagers skyrocketed to a peak of under 40 percent in the year 2007.
It can be seen that shopping has a steady increase from 2002 to 2007. In comparison, doing homework and playing sports were on a steady decline over the years among teenagers.
The Graph illustrates how much hours per week Adolescents in Chester spend doing Activities s over a 5 year Period starting from 2002 .
Overall , It is Noticeable that watching Television is among the popular activity of Adolescent , whereas Bowling comprises of least numbers of hours spent . While, Going to Pubs/Shopping has shown steadily rise over the year. IN contrast to that, others shown a Downfall, Except Watching DVDs which shown fluctuations.
Watching television comprises of around Quarter in 2002, which remain stabled for next year and reaching a maximum of among all activities by the period end for over 35 hours. Going to Pubs/Discos and Shopping started Period with around 5 hours per week Respectively which almost doubled over the period .
Teenagers spent around 12 hours doing their homework in 2002 which fell Rapidly to about 5 in 2007.On the other hand Playing sport fell dramitaclly from 10 hours to around 2 hours. While Watching Dvds showed some fluctuation starting from a little over 10 hours and ending the period with same figure.Time spent on Bowling was the Least about 5 Hours at the start which declined to around 2 hours.
Be very careful with your use of capital letters. Such mistakes will definitely lower your score and you are making frequent mistakes with capital letters.
is 260 words too much for this task?
Yes, 260 words is too much for writing task 1. Writing task 1 is designed to be a short report of between 170-190 words more or less. A report that is too long will reduce your score in Task Achievement, which is 25% of your marks.
The bar chart illustrate the hours per week that adults spending on other activities such as(Going to pubs, Watching TV, Shopping , Doing Homework, Doing Sport, Watching DVDs, Bowling) in 6 years from 2002 to 2007 in Chester.
Overall, the teenagers are spending more on watching TV than that of all activities. while, spending less time on Bowling per week in Chester.
Watching TV, Going to Pubs , Shopping is the most spend activities of hours(36,17,15) in 2007 well slightly fall in other years . Doing Homework spent around 12 hours per week in 2002 compare to all other activities.
Watching DVDs are highest spent hours of 16 in 2004 slight fall in following year. Bowling regularly spend in 2002 of 4 hours later on it decreases to 1 hour in 2007.
I don’t normally give feedback as that is not the purpose of my website. However, I will say your aim is to write over 150 words for writing task 1 and this is in the instructions given by IELTS. Your writing is around 130 words. While there is no automatic penalty anymore for being under the word count, it is definitely not something you want to do. You want your task 1 to be developed sufficiently. This means you need to extend your overview to include a description of specific key features. And you need to be more specific in your body paragraphs. Now go to the page above and compare my model answer with your writing. Go through and compare them both paragraph by paragraph and make a list of what you didn’t do.
The bar chart illustrates the number of hours an adolescent spent on many activities such as watching television, pubs and disco, homework, doing sport, watching DVD and bowling. In the year 2002 to 2007.
Overall, watching Tv was one of the activities the adolescent engaged in throughout the given year, while bowling was accounted for the least favourite.
Between the year 2002 and 2003, watching television was at 25 hours. However, it reached a peak of about 40 hours in the year 2007. Doing pubs and discos was between 5 and 10 hours in the year 2002 to 2003. It climbed dramatically to over 15 hours in the final year. Shopping was below 10 hours in the year 2002, the growth increased over the first 3 years and 15 hours in the 2006 to 2007.
Doing homework was over 10hours in 2002. However, there was a slight declined in the following year which fell steadily below 7 hours in 2007.Sports was accounted for 10hours in 2002-2004 and hit a low in 2007to less than 5 hours. Watching DVD fluctuated over the years and it reach a peak of over 20 hours in the year 2004 to 2005. Bowling was the least activities done by the teenagers which accounted for about 4 hours in 2002 and slightly declined to an hour in the final year.
Kindly give a feedback ma’am. Thanks for your selflessness.
.
I don’t normally comment on writing because that isn’t the aim of my website. However, I will mention that the overview is the most important paragraph in the whole of your task 1. If you mention just very simple key features, you’ll get a lower score for Task Achievement, which counts for 25% of your marks. Expand your overview.
The presented bar chart provides information about the duration that youngsters spent per week on several activities during five years (2002 to 2007) in Chester. Units are measured in hours.
Overall, it is apparent that watching television was the most popular activity, indicated by the most hours spent compared to other activities, whereas bowling was the least. Going to pubs/discos and shopping showed an increase during the given period, as opposed to other activities that consistently fell over six years, except for watching DVDs, which fluctuated.
In terms of watching television, this activity showed stagnant growth during the first two years (2002 and 2003) at 25 hours per week, and then climbed up to reach its peak at more than 36 hours in 2007. Both going to pubs/discos and shopping started from below 10 hours in 2002 and then steadily increased until the last year (around 17 hours and 15 hours respectively).
As for watching DVDs, the hours spent on this started at about 11 hours in 2002 and continued to grow until around 17 hours in 2004 before experiencing a decline from 2005 to 2007, with the last data at 10 hours. The remaining activities, which are doing homework and doing sports, kept decreasing from the starting period until the end, each accounting for about 7 hours and below 5 hours respectively in 2007.
The bar chart illustrates the time teenagers spend in a week doing certain activities from the year 2002 to 2007 in Chester. Overall, it can be seen that with time devoted to leisure activities like watching TV, going to pubs, and shopping increased in subsequent years.
Watching television caught a major chunk of the attention of teenagers. It stayed at the top throughout this time period and its percentage of time increased almost gradually each year. In the years 2002 and 2003, a total of 25 hours were spent watching TV which stood at whooping 37 hours in the year 2007.
Visiting pubs/discos rose marginally from the year 2002 till year 2006 and stood at 12 hours/week, but saw a jump and ended at 17 hours/week.
Time spent on shopping almost doubled in these years. In the year 2002, it stood at 7 hours/week and stood at 15 hours/week for the year 2006-7.
Watching DVDs saw a fluctuating pattern. It was a popular activity among young at the start of the year 2002 and got 11 hours/week and peeked at 17 hours/week in the year 2004. Afterward, it saw a decline in its popularity and in 2007 got 10 hours/week.
Remaining activities like doing homework, sports, and bowling saw a decline over the time period. Time spent on homework in 2002 was 12 hours/week but in the year 2007 it got only 7 hours per week.
Similarly doing sport received 10 hours in year 2002 but over the period reduced to 2 hours/week in year 2007. Bowling was the least popular activity among teenagers during this period and it saw a further decline in its popularity and stood at 1 hour/week in 2007.
👍🏻👍🏻👍🏻👍🏻
The bar chart demonstrates weekly time that teenagers spent on some activities in Chester between 2002 and 2007.
Overall, watching television was the most preffered activity by teenagers while bowling was the least activity across all given years. Moreover, going to pubs, watching television and shopping showed a steady increasing trend from 2002 to 2007 as opposed to doing homework and bowling which were less preffered by time in the period of 2002 and 2007.
Regarding going to pubs or dicos, children spent more than 5 hours in week in 2002 while this number rised to above 15 hours in 2007. Similar trend was also seen in watching TV, the amount of time spent was exactly 25 hours per week in 2002 whereas it wa slightly above 35 hours in 2007. When it comes to shopping, teenagers gave more than 5 hours to shopping activity in a week in 2002 and 15 hours in 2007.
On the other hand, the amount of time spent on doing homework, doing sport and bowling decreased from 2002 to 2007. In 2002, teenagers spent above 10 hours for doing homework, around 10 hours in doing sport and slightly under 5 hours in bowling. However, in 2007, the number of hours spent on these three activities was respectively as considerably less than 10 hours, under 5 hours, and considerably under 5 hours in a week.
18 minutes of writing, word count is 234.
impressive.
you should add at least one word about watching dvd…You missed that.
The provided bar chart offers insights into the weekly hours that young people in Chester invested in different activities between 2002 and 2007, with a breakdown by age, activity and year analyzed.
First and foremost, it is possible to observe that watching television is one of the most time consuming hobbies that these individuals had. In 2002, it was already the most popular activity, people invested 25 hours per week in front of the TV. However, starting in 2004, a noteworthy upward trend occurred; by 2007, people spent nearly 40 hours each week in this activity. Other pastimes, such as going to pubs or discos and shopping, became more fashionable during the final years of the period studied. Moreover, it is clear that teenagers invest little time practicing any sport or physical activity.
Overall, young people in Chester tend to be sedentary, hence, they spent most of the time from this five-year-period watching television. Other activities that were also included, hardly ever implied any type of sports.
The bar chart illustrates the number of hours per week that teenagers spent on various activities in Chester over a five-year period (2002 to 2007).
Overall, it can be observed that watching television was the favorite activity for teenagers from 2002 to 2007, with a gradual increase from approximately 25 hours per week to just over 35 hours per week.
In addition to that, watching DVDs was the second most favored activity during the initial three years (2002 to 2004) but saw a gradual decrease after 2004.
There was a small increase in the time spent in pubs and discos, rising from just over 5 hours per week to less than 20 hours per week.
On the other hand, teenagers also showed some interest in shopping, as indicated by the increase in the number of hours spent per week, rising from more than 5 hours to about 15 hours.
As time passed, teenagers showed less interest in doing their homework, considering it boring. This is evident from the decrease in the number of hours spent, dropping from about 10% to 5%.
The distribution of sports and bowling also indicates their declining interest in these two categories over the entire six-year period.
The bar chart gives information about how many hours youths spent doing a few kinds of activities in Chester over 5 years, from 2002 to 2007. The activities are divided into 7 types named going to pubs/discos, watching television, shopping, doing homework, doing sport, watching dvds, and bowling.
In general, the teenagers who lived in Chester most liked watching television, whereas they spent least time on bowling.
Youths in Chester spent 25 hours for Watching television in 2002, that rose significantly to almost 40 in 2007. The next teenagers favorite activity was watching dvds. The growth of this category fluctuated where in the beginning of period adolesencts spent over 10 hours a week however the end of the period decreased to 10 hours. Furthermore, the trend of doing exercise and doing homework decreased over the timeline, which over 5 hours and less than 5 hours respectively were spent by teenagers in the end of period
The infographic shown as bar chart compares the hours spending on different activities by Chester young people that took place in the 5-year period from 2002 to 2007.
Overall it can be seen that Chester adults used maximum time on watching TV whilst minimum spend on bowling in the given time period .
A closer look at the bar graph revealed that approximately 6 hours spend for going to pubs and discos in the year of 2002, and this figure
increased significantly reaching to about 16 hours in the final year.However figure of Homework stood at near 11 hour and this figure declined drastically, falling to about 6 hours . Furthermore young people used 25 hours on watching tv in 2002, there was a considerable increase in this activity in the final year.
Awesome wording. Thanks for sharing!
could you correct this bar chart for me ? Please
The bar chart illustrates the amount of time that teenagers spent doing some activities( going to pubs/discos, watching TV, shopping, doing homework, doing sport, watching DVDs, bowling) in six years from 2002 to 2007 in Chester.
Overall, it can be seen that teenagers spent the most hours on watching television for six consecutive years, while teenagers in Chester spent the lowest number of hours per week for bowling. Furthermore, a significant increase in the hours of teenagers spending was going to pubs/discos, watching television and shopping.
In terms of watching television, teenagers spent exactly 25 hours per week on this in both 2002 and 2003. This figure then rose steadily to reach a peak of below 40 hours per week in 2007. In addition, going to the pubs/discos and shopping was also increased in every single year. In the final year, going to pub/discos was spent higher hours each week than shopping ( over 15 hours and exactly 15 hours respectively. A similar growth in the figure for watching DVDs was reaching above 15 hours and reduced to 10 hours in the final year.
On the other hand, the hours of doing homework, doing sport and bowling was decreased. In six years, the least hours that teenagers spent was slightly under 5 hours in the first year and about 1 hour in final year.
This chart illustrates the hours per week used by teenagers in Chester to do certain activities from the years 2002 to 2007.
Watching television was the activity that teenagers spend the most time in all the years. The year 2007 had the highest figure of 38 hours and the lowest figure was noticed in the years 2002-2003 with 25 hours.
The activities that followed were watching DVDs, going to pubs, and shopping with an average figure of 8-15 hours for all years. Sports were also preferred up until 2006 which shows a steady decline in the hours spent. Doing homework also had a gradual decrease each year, from 10 hours in 2002 to 2 hours in 2007.
The least preferred activity that was noted in all years was bowling which had below 5 hours. Thus, it can be concluded that the most preferred activity in Chester by teenagers was watching television followed by shopping, going to pubs, watching DVDs, doing homework and sports.
The bar chart depicts how many hours every week teenagers in Chester engaged in several activities for 5 years from 2002-2007.
By comparing the given graph, it is observed that watching TV stands top among all the other activities with a rapid increase over the years. Whereas bowling consistently accounted for the last, merely standing less than 5 hours all throughout the years. Going to pubs and discos, watching TV, and shopping all showed an increase in the number of hours teens spent. While the other activities lost interest with time except DVD’s a bit fluctuated.
In 2002, there is only a few numbers of teens going to pubs and discos, but the figure gradually increased to about 12 hours in 2006, and then there was a tremendous increase where it reached as high as 17 hours in 2007.
The most popular activity is watching TV where it already gains 25 by just 2002 when it continually rose and gains its peak at almost 37 in the final year.
Similarly, Teens started to invest more of their time in shopping, reaching exactly 15 hours in 2006 and 2007.
On the other hand, Teens were less engaged with doing homework, sport, and bowling. The numbers declined every year and to only above 5 hours doing homework in 2007, less even than 3 hours doing sport, and bowling never even crossed the hour mark, the number fell more dramatically to almost 1 hour.
However, there is still an up and rise for DVDs where it started reaching its top of about 17 hours in 2007, it then dropped to about 10 hours in 2007.
Quick comment – review my model answers to see how paragraphs are used in writing task 1: https://ieltsliz.com/ielts-writing-task-1-lessons-and-tips/
The given bar depicts the amount of time spent by teens each week in 7 different activities in Chester from 2002 to 2007.
Overall, most of the adolescents invested their time watching television, and it remained their favorite activity throughout the given time period, followed by shopping and going to pubs and discos. The least preferred activity was bowling. where the hours spent watching DVDs can be seen fluctuating all the time.
The interest in watching TV grew among teens throughout the years, reaching as high as almost 37 hours per week, up from 25 hours per week in 2002. where the secondary interests were shopping and going to pubs and discos, where a gradual increase can be seen during the time period with very little fluctuation. where it reached the highest number of hours in 2007.
Where doing home work, playing sports, and bowling can be seen as less preferred and losing interest with time, a lot of variation can be seen in terms of DVDs, where it reached the highest of approximately 16 hours in 2004 and the lowest of approximately 10 hours in 2007.
The bar graph depicts the hours per week teenagers spend doing certain activities including going to pubs/discos, watching TV, shopping, doing homework, doing sports, watching DVDs, and bowling in Chester from 2002 to 2007.
On comparing the given bar graph, Watching TV stands top among all the other activities with a rapid increase over the years. Whereas bowling is noted as the last, in which adolescents spent less amount of time.
Watching TV is the major activity in which teens of Chester are engaged, they spend more than 35 hours per week on it. Watching DVDs and going to pubs/discos are followed by watching TV, it had a tremendous increase in the year 2002, the average time spent increased from 12 hours to 19 hours a week. Shopping, doing homework, and doing sport are next in which teenagers spend less than 15 hours a week. Bowling is the last interesting activity for them in which they merely spend less than 5 hours.
The bar chart illustrates the number of hours adolescents in Chester use per week doing seven different activities from 2002 to 2007.
Overall, watching television was the most preferred activity by most adolescents throughout the years while bowling was the least preferred activity.
Teenagers spent the most time watching television with an increase of 25 hours in 2002 to almost 40 hours in 2007. Going to pubs/discos and shopping increased through the years with pubs having an overall increase from about 10hours to 2002 to almost 20 hours in 2007 and shopping from about 7 hours in 2002 to 15 hours in 2007. Doing homework and sport kept having a decline along the years. While homework had a decrease from almost 15 hours in 2002 to about to about 7 hours in 2007, sport had a dramatic decline from 10 hours to less than 5 hours in 2007. About 10 hours was spent on watching DVDs in the first and final year,but reached a peak of over 15 hours in 2004 and 2005. Bowling was under 5 hours throughout the entire period.
The bar chart depicts the information about the time (in hours) adolescents spend doing activities like going to pub, watching television, shopping and more in Chester between the year 2002 to 2007.
Overall, in Chester, teenagers gradually spent most of their hours watching television while bowling was the least activity preferred by them.
Initially, teens spent approximately 25 hours in the first two years (2002 and 2003) which showed constant increase and reached around 38 hours per week at the end of the period. Similarly, they chose to go on pubs and discos for about 8 hours in 2002, which increased to about 12 hours in 2004 and remained stable till 2006. Later, it increased and peaked to about 18 hours per week. Likewise, teenagers were also spending time shopping; starting above 5 hours in the beginning of the start to increasing continuously to exactly 15 hours.
Moreover, activities like doing homework, sport and bowling showed a constant decrease. At the beginning of the period, adolescent spent about 12 hours which dropped significantly and reached to about 7 hours at the end of the period. Similarly, doing sport was also diminishing from exactly 10 hours from the start point to almost 1 hour at the end point. Among all the activities, teenagers spent below 5 hours of their time starting at about 4 hours to dropping tremendously to almost no hour at the end point.
However, there was fluctuation in the activity of watching television. It started at above 10 hours in 2002 that showed continuous rise to about 17 hours in 2004 and started dropping from about 16 hours to exactly 10 hours in the year 2007.
The bar chart illustrates the number of hours spent per week by teenagers in Chester on 7 different activities (Watching television, going to pubs/discos, doing homework, shopping, bowling, watching DVDs, and doing sports). The data is shown for a period of 6 years (from 2002 to 2007).
It is observed that the time spent on shopping, watching television, and going to pubs/discos has increased over the years. On the other hand, it has decreased for activities like doing homework, bowling, and playing sports. Moreover, the time spent watching DVDs didn’t have a particular upward or downward trend.
Though teenagers have spent the most number of hours on television, this number has increased from 25 hours a week in 2002 to more than 35 in 2007. While in 2002 they spent a little more than 5 hours a week going to pubs/discos and shopping, by 2007, this number increased to around 17 and 15 hours respectively.
On the other hand, time spent on homework, sports and bowling has decreased steadily over the years. For bowling, this number never crossed the 5-hour mark. For activities like sports and homework, this number went from around 10 and 12 hours in 2002 to 3 and 7 hours in 2007 respectively.
In 2002, a little more than 10 hours were spent watching DVDs. This number increased from there and reached its peak of around 17 hours in 2004 from where it again dropped to around 10 hours in the year 2007.
The bar chart illustrates how many hours adolescents in Chester spent on seven activities each week between 2002 and 2007.
Overall, the most popular activity over the period given was watching TV, whereas bowling was the least favourite. Going to pubs and discos, watching TV and shopping all showed an increase in the number of hours teenagers spent on these activities. The other pursuits showed a decrease in hours, except watching DVD’s which fluctuated.
Teenagers spent 25 hours on watching television in 2002 which increased to almost 40 hours in the final year. Both going to pubs and discos, and shopping more than doubled in hours from over 5 to over 15 and over 5 to exactly 15 respectively.
While teenagers occupied 10 hours doing homework in 2002, this figure dropped to just over 5 in 2007. Playing sport fell more dramatically from 10 hours to around 3 hours. Bowling was under 5 hours throughout the entire period declining by about 4 hours in total.
The number of hours teenagers dedicated to watching DVD’s was only 10 hours in first and final years, but reached a peak of over 15 hours in 2004 and 2005.
This bar chart illustrates a proportion of the hours every week consumed by teenagers in Chester in 5 years from 2022 to 2007 while they take part in several activities. The most significant portion of their time was consumed by watching television throughout the five years. The activity which seemed to be played the least by the teenagers was bowling which gradually decreased over time.
It should be noticed that there was a sharp inclination in the activity of going to pubs in 2007 which increased by 10 points on the y axis. The activity of watching DVDs gradually increased till the year 2004 followed by a gradual decline till the last year. The activity of watching television and shopping increased gradually over time while the activity of doing sports and bowling decreased with minor fluctuations. In 2007, watching television was the most time-consuming activity for the teenagers followed by going to pubs, shopping, watching DVDs, doing homework, doing sports,s, and bowling respectively.
The bar chart gives information about the no of hours spent by teenagers doing certain activites in chester for 6 years(2002 to 2007).
Overall,the teenagers spent more hours watching television which was about 25hours but less hours on Bowling which was about 7 hours.There was fluctuation in the time spent going to the pubs/Disco and watching DvDS for 6 years.Also,a decreased in the hours spent doing their homeworks and engaging in sporting activites for those 6 years.
The teenagers spent about 25hours in 2002 watching Televsion which increased to about 35hours and 37 hours respectively in 2005 and 2007.Also,an increased in duration spent on going to the pubs were also noticed which range from 2002 to 2006.(15hours to17 hours).
Decreased in sporting activites was noticed in 2002(10hours)to about 5hours in 2006,also decreased in their homework activities was also noticed as there was a dropped in the activity from 12hours in 2002 to about 5hours in 2007.
Increased in shopping activities was reported from year 2002 (6hours) to 15hours in year 2006.
The bar chart illustrates the information about how many hours per week teenagers spent doing some activities over the 6 periods (2002 to 2007) in Chester.
Overall, the most favorite activity was watching television over all of the periods, and bowling was the least favorable. While, time is consumed by other activities, going to pubs, shopping, doing sport, and watching DVDs approximately the same but lessen than watching television and more than bowling. The time consumed by the youth watching tv was the same in the first two years but steeply increased in the last three years. However, they spent time in entertainment acts like going to pubs, shopping increased every year, but it was not the case with homework it steadily decreased all over the years. Further, talking about the entertainment of watching DVDs, it fluctuated differently year by year.
However, the youth occupied almost around 11 hrs per week in clubbing until 2006 but sharply rose to about 17 hr in 2007. while all spare time used to watch tv in nearly 35~37 hrs in a week in the last three years, in the first two years it was still less, 25hr in a week. The number of hours kids dedicated to bowling was only around four almost unchanged, with slight fluctuation over the six periods. While The time is taken in shopping steps up from around 7 hrs to 15 hours, it steps down in the case of homework and sports from around 12hrs to 7hrs and 10 hrs to 3hrs, respectively.
here is my own version.
The bar chart details about activities in which students in Chester, UK spends most over years of 2002 till 2007. Activities includes, going to pubs and disco´s, watching television, shopping, doing homework, doing sport, watching DVD´s and bowling.
The main time consuming activity that a teenager does during the 2002 data was watching television, which noted over the years has been taking the lead up to year 2007.
Meanwhile, going to pubs and disco´s, as a way to release student life tension has become subtle as they spend 8 to 11 hours from year 2002 to 2006 and with sudden rise on the next year. More so likely on watching DVD´s, with fluctuating data but similarly would be the third leading data being scored.
Shopping and doing homework are similarly contrast, in a way that since the beginning of 2002 gradual hours were spend from doing shopping with slow rise up to 2007. Whereas, students doing homework tends to be decreasing as years passes by.
Doing sports and bowing seems to be little of no interest to most teenagers living in Chester, except per se for the athletes who are entitled to have fitness time.
The bar chart illustrate the amount of time that teens spent their spare time on several activities between 2002 to 2007 in Chester town.
It can be seen that, the teenager were attracted to the watching television compared to the other activities. On the other hand, Bellowing was the lowest favorite game for the adolescents. While, Going pup/discos increased gradually as opposed doing sport.
Bowling was the least rate throughout the years.
Teens spent approximately 36 hours on watching television in the period 2007 which was he highest amount of time, the percentage of going to pups/discos and shopping was leveled up.
In term doing homework occupied 10 hours in the year 2002.In contrast, the proportion was dropped slightly. Doing sport fell from 10 hours to 0 in year 2007.
Bowling was below 5 hours in all years,
The percentage in the watching DvDs the rate was fluctuatingز
i.m going to write introduction and overview becouse i do not write body paragraphs i begin to writing tas1 soon. And now I.ll try to write as much as possible .Liz support me please.
The bar chart highlights information about the number of teenagers which spent their part of time doing some activities in Chester over a five-year period between 2002 and 2007.
Overall what stands out from the bar chart is that, almost all of the teenagars spent their leasure time to watch TV increased rapidly over the whole question whereas bowling was plummet during five year.
The given bar chart defines how many hours teenagers spent per week on seven different activities, between 2002 and 2007 in Chester.
Overall, it can be seen that teenagers spent most hours on watching television compared to other activities. Bowling seemed to be the least favorite game for teenagers while spending hours on pubs, discos, and shopping showed a constant increase. Contrary, doing homework and sports showed constant declines.
In 2002, adolescents were spending 25 hours on watching tv per week, which reached to its peak of almost 37 hours per week in the last year. Initially, they were spending 10 hours per week on DVDs, which then rose to almost 18 hours per week, before falling again to 10 hours per week. Going to discos/pubs and for shopping started from 5 hours per week and reached to 17 and 15 hours per week respectively.
In beginning, adolescents were spending 12 hours on homework and 10 hours on sports per week, and with a continuous decrease, it reached to almost 7 and 2 hours in 2007. Time spent on bowling never went above 4 hours per week throughout the given time period.
The bar graph illustrates the study of Chester from 2002 to 2007 about the amount of time (hour) they spent on described activities.
Watching television is dominating every other activity performed by teenagers. In 2002 and 2004, the number of the hour is 25 hours per week on watching television and is rapidly increased in following years and reached the maximum of 47 hours in 2007. The least number of time spent watching television is more than the highest spending hour on other activities.
The chart shows that teenagers are not so interested in sports. Because the least two activities based on time-consuming are doing sport and bowling which is 10 Max in 2002 and 4 max in bowling. But the rate is decreasing from 2002 to 2007.
Watching DVD have more fluctuation than other listed activities. The record shows that the targeted group has spent more hours going to Pubs/Discos. 7 hours minimum in 2002 and 18 hours maximum in 2007. Shopping and doing homework has many similarities where they spent 7 hours and 18 hours at low and 15 hours and 18 hours at maximum respectively range from 2002 to 2007.
The bar chart illustrates the ratio of weekly hours British youth spend on various activities in the Britain during the period of 2001-2008.
Overall, watching TV was most preferred (initially 25%) and bowling being the least attractive activity. Whereas, all the remaining activities hold significantly less proportion.
The trend of watch TV during the period has significantly escalated from 22% in 2001 to 38 % in 2008. Initially for two years, youth watched TV for 25 which drastically increased to 38 hours in 2007. Initially, adolescents spent 8 hours weekly initially going to disco bars and pubs, which a slight increase next year, then remained stagnant (12 hours) for 3 years and by the end sharply escalated to 18 hours per week.
Bowling, being the least preferred activity, was initially under 5 hours weekly, which fell to only 2 hours by the end of the period. Time spent shopping has shown a steady growth whereas doing homework has shown a relatively minimal decline over these years. Playing ports fell drastically from 10 to 2 hours. Watching DVDs fluctuated between the years, initially 10 hours to extreme 18 hours and again 10 hours in 2007.
The bar chart depicts the amount of time teenagers in Chester spend doing certain activities for a week from the year 2002 to 2007.
Watching television is one such activity that most teenagers are involved in over the years, they spent around 25 hours a week in 2002 and it has been constantly increasing from then, in 2007 this activity recorded the highest number of hours spend by teenagers with around 37 hours a week.
Another such activity which showed increased interest among the teenagers is going to pubs/discos, with an initial of 7 hours a week in 2002 to 17 hours a week in 2007. Teenagers also showed interest in shopping as seen from the chart where they spent about 7 hours a week in 2002 and it increased to 15 in the year 2007.
Among the activities, doing homework and doing sports are the only two that has seen a considerable decrease in the amount of time spent by a teenager over the years, with doing homework going down from 13 hours a week in 2002 to 7 hours a week in 2007 and doing sports from 10 hours a week in 2002 to 3 hours a week in 2007. Watching DVD’s showed a fluctuation over the years with a highest of 17 hours spent in a week in 2004. Bowling is found to be the least favorite activity depending on the hours a week when compared to other activities, with a highest value of 3 hours a week in 2002.
Dear Liz,
Thank you so much for the rich content it has been crucial for my studies. I was hoping to have your opinion about my answer on this chart.
The chart illustrate the weekly hours that teens in Chester spent on specific activities between the years of 2002 and 2007.
Overall, teenagers used most of their weekly hours watching TV and minimum time playing bowling. Going to pubs and discos, watching TV and shopping revealed an increase in the amount of hours as opposed to the remaining occupations that decreased, except watching dvd’s which the hours spent on it have oscillated during the period of six years given.
The young in the english city spent 25 hours per week on watching TV in 2002 and almost 40 hours in 2007. While time spent on both going to pubs and discos and shopping have more than doubled between the same period, starting at 5 hours per week and reaching over 15 and exactly 15 hours respectively.
In terms of sports and bowling the numbers dropped approximately a quarter, starting at 10 and almost 5 hours and falling to around 2 and 1 hour respectively in the last year. As well as the hours doing homework fell almost in half (from around 13 hours to more or less 7 hours). In the other hand time spent watching DVDs started and finished almost the same (slightly over 10 and exactly 10) with a fluctuation in the middle (15 hours in 2003, over 15 in the next two years and around 13 hours in the 2006).
The bar chart illustrates the amount of time that teenagers spend in activities per week in six years from 2002 to 2007 in Chester. units are measured in hour.
Overall, it can be seen that teenagers spend most of their time in watching television, while bowling consistently accounted for the lowest amount of time. Furthermore, a significant increase in the time which teenagers spent on watching television can be seen over the period given.
The terms of watching television, the figure remained relatively stable in the first two years (about 25 hours per day). From this point, the figure climbed gradually to peak at about to the peak at about 38 hours per week in 2007. With regard to the consumption of time watching DVDs used, it began at around 10 hours in 2002. This figure then rose steadily to reach a peak of almost 18 hours in 2004,before falling slightly to 10 in the final year.
On the other hand, the amount of time which was spent in doing homework started at about 13 hours, which was the peak during the period given. However,the figure fluctuated slightly and dropped to a low of around 7 hours in the final year. A similar decrease in the figure for doing sport and bowling were evident reaching about 2 and 1 hours respectively in the final year.
The bar chart illustrates the hours per week spent by adolescents in performing particular activities in the period between 2002 and 2007 in Chester.
Overall, regardless of the year, watching television exhibited the highest performed activity compared with the others. In contrast, bowling activity revealed the lowest one. Moreover, a fluctuation in the time consumed for participating some activities was evident throughout the investigated years.
Compared with the other years, in 2007, some activities such as watching television, going to pubs/discos and shopping reached a maximum peak of approximately 38 hours, 17 hours and 15 hours, respectively.
Other activities like doing homework and doing sport, a gradual decline in the time consumed for carrying out such pursuits was observed along with the investigated period. They reached a maximum spent time of about 13 h and 10 h in 2002 and a minimum one of about 7h and 3h for doing homework and doing sport, respectively.
A profound look to the bar chart, a fluctuation in the recorded time was noticed for watching DVDs and bowling throughout the whole period attaining a marked drop to about 10 h and 2 h in the last year, respectively.
The given bar chart illustrates that the hours per week that adolescents spend doing specific activities such as going to pubs, watching television, shopping, doing homework, doing sports, watching DVD’s and bowling between the year 2002 to 2007 in Chester.
Overall, the most favorite activity over the period is watching the Television and the least one is Bowling. Going to pubs/discos, shopping, and watching Television all showed an increase in the number
of hours spent by teenagers. The bar chart shows a decrease in the number of hours spent on doing homework and bowling however the watching DVD’s has fluctuated.
In the year 2002, teenagers spent near 10 hours by going to pubs and discos and continues to increase in the time year by year, it was almost 20 hours in the final year. In the year 2002, 25 hours of a week spent by teenagers on watching Television and remain the same in the year 2003 but in the year 2004 it rose and recorded as 30 hours and over 35 hours a week in the final year. Over 5 hours per week spent on shopping in the year 2002 and hiked it to 10 hours in the very next year and it remain the same for the next year then it rose again up to 15 hours in the year 2006 and 2007.
By considering other activities, 12, 10 hours of a week spent on homework and doing sports by the teenagers in year 2002 and in the final year it reached 8 hours and 3 hours respectively. The activity of watching DVD’s was variable, It was the same in the beginning and the final year but fluctuating in the other years. The less hours of a week spent on the Bowling by youngsters, in the year 2002 it was recorded as 3 hours and the final year it was just 1 hour.
The given bar chart provides information about the number of hours spent by adolescents in Chester each week between 2002 and 2007.
Overall, as it can be seen that the most popular activity was watching television while bowling was the least favourite. Going to pubs/discos and shopping gradually increased throughout the given period as opposed to the hours spent on doing homework and doing sports. Furthermore, watching DVDs reached a peak in the middle of the period after which gradually declined.
In terms of the most significant feature of the chart, the number of hours spent watching television was high above every given activity. It started at exactly 25 hours per week in the first year and reached its highest point at about 38% in the final year. In stark contrast, bowling became the least popular activity which was under 5 hours throughout the entire period declining precipitously by about fours in total.
Turning to the other activities, the hours spent on shopping witnessed a gradual rise from around 7 hours to exactly 15 hours in the final year. Likewise, going to pubs/discos had considerable growth in the first three years 8 hours after which remained stable for another three years before drastically surged in 2007 to nearly 18 hours per week. In contrast, the hours spent on doing homework and doing sport saw a steady decrease to reach at 8 hours and 3 hours, respectively. In addition to watching DVDs, the trend demonstrated a notable increase to reach a peak of around 18 hours by 2004 before declined to about 10 hours where it began at the start of the period.
Just a quick tip: don’t use “/”. You need to write everything in full – going to pubs or discos.
Dear Liz,
Thank you for your helping and I hope you will have time to check my essay.
The bar chart illustrates the six different functions that adolescents spend their time in Chester between 2002 and 2007. Units are measured in the number of hours each week.
Overall, it can be seen the most popular activity of teenagers spend time recorded on watching TV. Going pubs and discos and watching DVD’s made up significant an increase, while the less attractive activity for full of ages was on bowling.
Teenagers spent 25 hours watching television in 2002, which increased almost 40 hours in the final year. The number of teenagers dedicated to watching DVDs was only 10 hours first and final years but, reach a peak over 15 hours between 2004 and 2005. Both going pubs and discos and shopping from over 5 to over 15 to exactly 15 respectively.
The number of hours adolescents doing homework recorded just over 10 in 2002, this figure dropped to just over 5 in 2007. Doing sport was exactly 10, however, rapidly decreased form under 5 to in the final year. The lowest attractive activity of teenagers on bowling was under 5 hours throughout the overall period decline by about 4 hours in total.
Sorry I don’t offer marking.
Hi liz, your videos are helpful especially to someone who is skeptic about the exam. Let me share my writing part 1 and hope you have time to read and give some points to improve. Thank you.
The bar chart demonstrate the time allotted per week that teenagers spend doing certain activities from 2002-2007 in Chester.
Overall, watching television consumes the most of the teenagers time consistently from the year 2002 up to 2007. While playing bowling has the least used hours in 2002 and further decline in 2007.
In 2002-2003 adolescent allotted their time watching television for about 25 hours per week and it has gradually increased to 30 hours respectively in 2004-2007.
Watching DVD’s is the second activity were teenagers spend time. 15 hours per week in 2004 was being used and declined to 10 hours in 2007.
On the other hand, the least activity were the teenagers consumed less time was playing bowling. From 2002 about 4 hours was spend per week and significantly declined to less than 1 hour in the year 2007.
From the year 2002-2006 other activities such as going to pubs, shopping, doing home work, and doing sports were consistently enjoyed in less than 10 hours. While in 2007, only going to pubs/discos the number of hours spend jumped rapidly around 15 hours.
Hi Liz,
I have written this task by myself.
Please, can you correct my task? so I can know my mistakes, and how much score do I get?
The bar chart illustrates how much teenagers in Chester spend there time every week doing particular activities between 2002 to 2007.
Overall, it is clear that, watching television was exceeded than other activities. In fact, watching television was the most significate than in other activities. While playing bowling was the least popular activity throughout the years, teenagers were spent there time less than 5 hours per week in bowling between 2002 to 2007.
There are four activities that had a similar period of time between 2002 to 2005. In terms of watching television teenagers spend 25 hours between 2002 to 2003, but in 2007 they spend more time approximately 40 hours per week. Furthermore, between 2004 to 2005 teenagers spend time going to discos around 10 hrs. However, after two years in 2007, they spend more time about 15 hrs.
With regard to shopping, the majority of teenagers between 2006 to 2007 preferred to spend their time going shopping was exactly 15 hrs. The similarity, between 2003 to 2004 was teenagers had spent around 10 hrs for going shopping and doing their homework.
Dear Liz,
I have written this task as follows:
The below chart illustrates the number of hours that young people have spent on various activities from 2002 to 2007 on a weekly basis.
Overall, watching TV has remained the most popular activity for the whole span, while bowling has been the least favorite one. Not only is watching TV the highest figure in terms of spending hours, but it has seen a dramatic rise over the years.
Besides watching television which has reached a peak of about 37 hours in 2007, the other leisure activity of going to pubs/discos has increased from 7 hours in 2002 to about a maximum of 18 hours in 2007. Watching DVDs on the other hand has lost its popularity after reaching a peak of 18 hours in 2004 evident by falling to 10 hours in the final year.
In terms of educational activities, doing homework has been on a constant decline over time, changing from about 12 hours per week to about 7 hours in 2007. Similarly, athletic activities have seen the same reducing pattern but with a more dramatic decline after 2005, sitting on about 2 hours in 2007.
This is quite helpful dear Liz.
My aim is to achieve band 7.5 for PLAB.
I have been doing practice and your website is helping me a lot , I have learned so many new things and tips to possibly achieve good band.
Cheers.
I wish you good luck! 🙂
Thanks liz,i used to go through your lessons frequently and that’s really a complete stuff. 100% SATISFIED with your teaching. God bless you🙂😇
There is no conclusion paragraph for task 1?
No. An overview is required which contains all key features.
The bar chart illustrates six different activities teenagers spent their time on them, measured by hours weekly in Chester between 2002 to 2007.Overall, watching television was the most popular activity while bowling was the least interesting activity across all years.
As is presented, 25 hours have been spent on watching TV at 2002 to increase to almost 37 hours in 2007. On the other hand, bowling was below 4 hours within the given period to fell to 1 hour in 2007.
Regarding going to pubs/discos and shopping activities stood at 7 and 6 hours respectively to continue rising. 2007 witnessed more hours spent on discos by 10 hours and 15 hours weekly on shopping.
Doing homework and spot both were falling down except sport hours dropped more dramatically than homework hours. While, watching DVDs was just above 10 toreach the trough of 17 hours in 2004 and leveled off at 10 hours.
Thank you Liz for he excellent website
My answer
The bar chart illustrates the time spent by teenagers in different activities in Chester from 2002 to 2007. The unit of time used is hours per week.
At a first glance, it is clear that the teenagers have been gradually spending less time on physical activities such as sports or bowling. Other activities, that have shown increasing involvement over the years include going to pubs/discos and shopping. Further, their favourite pastime has been watching television and its popularity has been on the rise.
Among teenagers in Chester, the favourite leisure activity had been watching television. In 2002, they spent 25 hours per week on it and this gradually increased to around 37 by 2007. Other activities that had gained popularity include shopping and going to pubs or discos. In 2002, an average teenager spent close to 7 hours shopping and this rose gradually to 15 hours per week by 2007. When it came to going out to pubs or discos, teenagers spent approximately 8 hours per week in 2002. While this rose to around 12 hours by 2004, it remained so for 3 years until a steep incline to around 18 hours per week in 2007.
Teenagers had been spending less amount of time doing homework. In 2002, they spent close to 12 hours per week on homework and this came down to around 7 hours per week by 2007. Similarly, the time spent on sport came down from 10 hours per week in 2002 to close to 2 in 2007. Bowling was always the least popular activity and the time spent on it came down from approximately 4 hours per week to just about an hour per week.
Teenagers did spend some time watching DVDs and spent around 11 hours a week on them in 2002. A steep rise was followed by a similar decline in the interest in DVDs and by 2007, teenagers spent 10 hours a week on watching DVDs.
The bar chart illustrates the hours teenagers spent weekly on six different activities in chester, from 2002 to 2007.
Overall, watching television was the most popular activity and bowling was least interesting in the given period of time.Going to Pubs/discs, shopping and watching DVDs were also given considerable amount of time while the rest shown decline year after year.
Watching TV was given 25 hours per week for the first two years which rose to almost 35 hours in 2007.Going to pubs/discs showed almost 15 hours increase from 2002 to 2007.Secondly shopping also increased from just above 5 hours in 2002 to 15 hours in 2007 and watching DVDs increased for the first three years before declining to 10 hours in 2007.
Doing Home work and sport descent over the period of time, Home work reaching just above five hours and sport well below 5 hours by 2007.Bowling was given least of the time , it degraded from well above 5 hours to well below 5 hours by the end of 2007.
Hello liz, kindly check my answer for this take and guide me to know the areas of improvement i should practice.
Thanks for everything you are doing for us.
The bar chart illustrates how many hours weekly spent by adolescents on seven activities ( going to pubs/discos, watching TV, shopping, doing homework, doing sports, watching DVDs and playing bowling )in Chester over 6 years from 2002 to 2007.
Overall, watching television was the most popular activity over the given period, whereas the bowling activity was the least one. Watching Tv, going to pubs/discos, shopping and going to pubs/discos all showed increase in the number of hours was spent by teenagers. Other activities showed decrease in the number of the hours except watching DVDs which fluctuated.
Adolescents spent 25 hours watching television in 2002 and 2003 then this number gradually increased to 30 hours in 2004 and peaked in 2007 by 37 hours. On the other hand shopping figures showed modest increase from 6 hours in 2002 to 15 hours in 2006 then plateaued in 2007 as well as going to pubs/discos depicted 8 hours in 2002 and gradually increased to 12 hours in 2004 then plateaued for 3 successive years and surged at the end of this by 19 hours.
Doing homework activity showed modestly decrease from around 12 hours to 7 hours in 2007 whereas doing sport plummeted from 10 hours to around 3 hours weekly in the same year. Bowling was below 5 hours within the whole period and dipped to 1 hour in the final year
Hello Lisa,
Thank you for your help and support. I have started watching your videos recently. I feel writing is bit more difficult. Could you please guide me on the below essay.
The bar chart provides with the information for the teenagers carrying out different activities (going to pubs or discos, watching television, shopping, homework, sports, watching DVDs and bowling) from the years 2002 till 2007. The unit is measured in the number of hours per week.
Overall, the most popular activity among the teenagers is watching television while the bowling remains the least popular in all the years. Additionally, certain activities have gradually decreased as the years passed by namely, doing homework, sports and bowling.
Pubs, watching television, shopping and watching DVDs have seen a considerable amount of increase with the years passing by with the peak of year 2007 for pubs and discos which showed a sudden increase of about 17 hours in a week.
Watching DVDs also has a volatile increase It showed a gradual increase till the year 2004 and later with significant decrease to almost 10 hours of a week.
The bar graph demonstrates details regarding the number of hours that teenagers spent weekly in doing different kinds of activities in Chester from 2002 to 2007.Generally it can be seen that there was an increase in the length of time that teenagers spent on going to pubs/discos so as with watching television and shopping over the given periods.However doing homework,sports and bowling experienced a decline in popularity while watching DVDS fluctuated in the amount of time spent.Watching television became the most favourite pastime having the most number of hours spent in contrast with bowling which was the least preffered activity.
In detail it is apparent that the amount of time spent in watching television stood at 25 hrs in the first 2 years.The figure rose up to peak at about 30 hrs in the final year.Similarly,going to pubs/discs and shopping more than doubled in the number of hours spent from 5 to over 15 and from over 5 to exactly 15 respectively.
Meanwhile, the amount of time spent on making homework and playing sports experienced a decline from 12 hrs to 7 hrs and 10 hrs to 3 hrs respectively over the the 6-year period so as with bowling from 4 hrs in the beginning to at least 1 hr in the final year.
On the other hand ,the number of hours spent for watching dvds stood at 10 hrs for both initial and last year but experienced to peak at 18 hrs in 2004.
Can you change adolescents to teenagers
Yes.
What a blessed teacher Liz..
The bar chart illustrates that how many hours adolescents in Chester utilised on seven activities each week between 2002 and 2007.
Overall, teenagers dedicated their maximum hours for watching television which was their favourite activity, whereas bowling was their least favourite.
It is clearly seen that teenagers spent 25 hours for watching television in 2002 but after five years it was at peak level of almost 40 hours. Both going to pubs/discos and shopping, juveniles occupied over 5 to over 15 and over 5 to exact 15 respectively. There was also a one activity which was bowling, it was under 5 hours throughout the entire period declining by about 4 hours in 2007.
In addition, adolescents utilised their more than 10 hours for doing school work in 2002 but, with small changes in next years, it decreased by 6 hours in 2007. 10 hours spent by juveniles in 2002 but after dramatic drop it was just 3 hours. Utilisted time on watching DVDs was 10 hours in 2002 but after fluctuation in hours it was again at same rank in 2007.
Mam plz check my mistakes and give me band score plzzzz ……bcz I am preparing my exam at home
should i leave a space (about 1 cm) before each topic sentence
You can either indent your first word of the paragraph or you can leave one line empty between paragraphs. I prefer the second option because it is easier for the examiner.
The provided bar graph demonstrates the total time spent by the adolescents on seven different activities each week from year 2002 to 2007.
Overall, the activities where the teenagers spent plenty of time were going to pubs/disco, watching television, and shopping. While on the other hand doing homeworks, playing sports, and bowling were the least preferred activities by the adolescents. However, the hours spent in bowling fluctuates each year.
The Juveniles spend 25 hours watching television in the year 2002 which was increased in the final year (2008). Meanwhile, going to pubs/discos teenagers spent above 5 hours in 2002 which remained stable in the next 3 years (2004,2005,2006 respectively) with approximately 12 hours in this activity (pubs/discos) that follows having a rapid hours of growth in year 2007. Same as going shopping, the adolescents spent more than 5 hours in 2004 which was increased in the final year.
Moreover, teenagers spent 10 hours doing their assignments in year 2002 which dropped nearly 6 hours by year 2007. Similarly in playing sports which dramatically decreased from 10 hours to approximately 2 hours by the final year. Meanwhile the bowling activity always had least hours spent by the juveniles which remained less than 5 hours from 2002 to 2007. The number of youngsters that watched Digital VideoDisc reached approximately 10 hours in the first and final year and increased above 15 hours in year 2004-2005.
Wowwww
This is impressive!
Hi Liz, although it’s a very high band scoring answer but why didn’t you use any connective word in body paragraphs
Linking words used: Overall, whereas, while, but. In a short report, that is actually reasonable. To add more, you could use “Furthermore, In addition”. Using any more would be an over-use of linking words which would lower your score. You don’t need a linking word in each sentences. There are only 10 sentences, this model answer used 4. If you use 6, that’s great.
Thanks you are always excellent, mam
D-G-C-B-A-H-I-E-J-F
My guess is: D- intro,
G and B – overview,
C,I,A,E – BP 1,
B,J,H,F – BP 2.
Introduction: D
Overview: G
Body Paragraph 1: C,I, A, E
Body Paragraph 2: B, F,J, H
Good stuff for writing, Liz! Thank you!
D-G-C-I-A-E-J-H-B-F
Introduction -D
Overview-G
Paragraph 1-A C I F
Paragraph 2-E HI B
D G C B A I E J F H
Introduction-D
Overview-G H
Paragraph 1,B,C,I,F
paragraph 2, E,H,J
Conclusion, B
The bar chart illustrates how many hours adolescents in Chester spent on seven activities each week between 2002 and 2007. Overall, the most popular activity over the period given was watching TV, whereas bowling was the least favourite.
Going to pubs and discos, watching TV and shopping all showed an increase in the number of hours teenagers spent on these activities. The other pursuits showed a decrease in hours, except watching DVD’s which fluctuated.
Teenagers spent 25 hours on watching television in 2002 which increased to almost 40 hours in the final year. While teenagers occupied 10 hours doing homework in 2002, this figure dropped to just over 5 in 2007. The number of hours teenagers dedicated to watching DVD’s was only 10 hours in first and final years, but reached a peak of over 15 hours in 2004 and 2005. Both going to pubs and discos, and shopping more than doubled in hours from over 5 to over 15 and from over 5 to exactly 15 respectively. Playing sport fell more dramatically from 10 hours to around 3 hours. Bowling was under 5 hours throughout the entire period declining by about 4 hours in total.
D G C E I F B J A H
The bar chart illustrates how many hours adolescents in Chester spent on seven activities each week between 2002 and 2007.
Overall, the most popular activity over the period given was watching T.v whereas bowling was the least favorite.
Going to pubs and discos, watching T.v and shopping all showed an increase in the number of hours teenagers spent on these activities While teenagers occupied 10 hours doing homework in 2002 this figure dropped to just 5 in 2007. Both going to pubs and discos and shopping more than doubled in hours from 5 to over 15 and from over 5 to exactly 15 respectively. The number of hours teenagers dedicated to watching DVDs was only 10 hours in the first and final years, but reached a peak of over 15 hours in 2004 and 2005. The other pursuits showed a decrease in hours, except watching DVDs which fluctuated. Playing sport fell more dramatically from 10 to around 3hours.
Teenagers spent 25 hours on watching Television in 2002 which increased to almost 40 hours in the final year. Bowling was under 5 hours throughout the entire period decling by about 4 hours in total.
D G C E I F B J A H
D C I A E J H B F G
The bar chart illustrates how many hours adolescent in Chester spent on seven activities each week between 2002 and 2007.
Overall, the most popular activity over the given period was watching TV, whereas bowling was the least favourite.
Going to the pubs and discos, watching TV and shopping all showed an increase in the number of hours teenagers spent on these activities. Both going to pubs and discos, and shopping more than doubled in hours from over 5 to over 15 and from over 5 to exactly 15 respectively. Teenagers spent 25 hours on watching television in 2002 which increased to almost 40 hours in the final year.
While teenagers occupied 10 hours doing homework in 2002, this figure dropped to just over 5 in 2007. The other pursuits showed a decrease in hours, except watching DVD’s which fluctuated. The number of hours teenagers dedicated to watching DVD’s was only 10 hours in first and final years, but reached a peak of over 15 hours in 2004 and 2005. Bowling was under 5 hours throughout the entire period declining by about 4 hours in total. Playing sport fell more dramatically from 10 hours to around 3 hours.
According to my opinion, the correct order is D, G, C, B, A, I, E, J, F.
1. Introduction (D)
The bar chart illustrates how many hours adolescent in Chester spent on seven activities each year between 2002 and 2007.
2. Overview (G, C, B)
Overall, the most popular activity over the period given was watching TV, whereas bowling was the least favorite. Going to pubs and discos, watching TV and shopping all showed an increase in the number of hours teenagers spent on these activities. the other pursuits showed a decrease in hours, except watching DVD’s which fluctuated.
3. Body Paragraph 1: Categories that increased over time (A, I)
Teenagers spent 25 hours on watching television in 2002 which increased to almost 40 hours in the final year. Both going to pubs and discos and shopping more than double in hours from over 5 to over 15 and from over 5 to exactly 15 respectively.
4. Body Paragraph 2: Categories that decreased over time (E, J)
While teenagers occupied 10 hours doing homework in 2002, this figure dropped to just over 5 in 2007. Playing sport fell more dramatically from 10 hours to around 3 hours.
5. Body Paragraph 3: Category that fluctuated (F) *)
The number of hours teenagers dedicated to watching DVD’s was only 10 hours in the first and final year but reached a peak of over 15 hours in 2004 and 2005.
*) Note: Body Paragraph 3 can also be added at the end of Body Paragraph 2.
The bar chart illustrates how many hours adolescents in Chester spent on seven activities each week between 2002 and 2007. Overall, the most popular activity over the period was watching TV, whereas howling was the least favourite.
Teenagers spent 25 hours on watching television in 2002 which increased to almost 4 hours in the final year. Going to pubs and discos, watching TV and shopping all showed an increase in the number of hours teenagers spent on these activities. Both going to pubs and discos, and shopping more than doubled in hours from over 5 to over 15 and from over 5 to exactly 15 respectively. The number of teenagers dedicated to watching DVD’s was only 10 hours in first and final years, but reached a peak of over 15 hours in 2004 and 2005.
The other pursuits showed a decrease in hours, except watching DVD’s which fluctuated. While teenagers occupied 10 hours doing homework in 2002, this figure dropped to just over 5 in 2007. Playing sport fell more dramatically from 10 hours to around 3 hours. Bowling was around 5 hours throughout the entire period declining by about 4 hours in total.
D
CAI
BFEJH
G
D-C-A-I-B-F-E-J-H-G
The bar chart illustrates how many hours adolescents in chester spend on seven activities each week between 2002 and 2007.
Teenagers spent 25 hours on watching television in 2002 which increased to almost 40 hours in the final year. While teenagers occupied 10 hours doing homework in 2002, this figure dropped to just over 5 in 2007.
The other pursuits showed a decreased in hours except watching DVD’s which fluctuated. The number of hours teenagers dedicated to watching DVD’s was only 10hours in first and final years , but reached a peak of over 15 hours in 2004 and 2005.
Going to pubs and discos, watching TV and shopping all showed an increased in the number of hours teenagers spent on these activities. Playing sports feel more dramatically from 10hours to around 3 hours.
Overall, the most popular activity over the period given was watching TV, whereas bowling was the least favourite.
D,G,A,C,I,E,H,J and F
D,G,A,C,F,I,B,E, and J
D C I A F H B E J G
D,C,E,F,J,H,G
D,C,B,I,A,E,J,F,H,G
introduction:D
Overview:GCB
Body para 1:AE(using linking words )
body para2:IBJ(using linking words), then JH as final sentence.
organisation:DGCBAEIBJJH
The bar chart illustrates how many hours adolescents in chester spent on seven activities each week between 2002 and 2007 .
Overall , the most popular activity over the period given was watching TV , whereas bowling was the least favourite .
Going to pubs and discos , watching TV and shopping all showed an increase in the number of hours teenagers spent on these activities . Teenagers pent 25 hours on watching TV in 2002 which increased to almost 40 hours in the final year . Both going to pubs and discos ,and hopping more than doubled in hours from over 5 to over 15 and from 5 to exactly 15 respectively . The number of hours teenagers dedicated to watching DVDs was only 10 hours in first and finally years , but reached apes of over 5 hours in 2004 and 2005 .
The other pursuits showed a decrease in hours , except watching DVDs which fluctuated .While teenagers occupied 10 hours doing Homework in 2002 , this figure dropped to just over 5 in 2007 . Bowling was under 5 hours throughout the entire period declining by about 4 hours in total . Playing sport fell more dramatically from 10 hours to around 3 hours .
D,C,B,I,A,J,E,F,H,G
D,G,E,F,A,H,I,J
A) 2007
B) year 2007
C) 73 hours
D)watching TV in 2007
E) yes
F) yes
G) 2007
H) year 2002
I) from2002 to 2007
J) from2002 to 2007
D G C I B F E J A H. Thank u Liz for this exercise on task 1. Expecting the model answer tmrw
D, C, A, I, B, J, H, E, F, G
D,C,B,A,I,E,J,H,F,G