IELTS General Training & Academic Writing Differences Explained

Learn about IELTS GT (General Training) exam content and writing tasks. Learn how the IELTS GT writing is different from the academic writing test.  Useful links are provided for GT students below.

Understanding GT IELTS

  • The GT listening test is the same as the academic test. Everyone takes the same listening test with the same scoring. You can use my free listening lessons and tips for your preparation. Click here: Free Listening Tips & Lessons
  • The GT speaking test is the same for everyone. There is one speaking test only with the same scoring. You can use my free speaking lessons and tips for your preparation. Click here: Speaking Tips & Model Answers
  • The GT reading test is slightly different. The question types are 100% the same as the academic test, but the passages have a different content and layout. You can use my free reading lessons and tips for your preparation, but make sure you do full authentic GT reading tests at home. See this page for more GT reading information:  GT Reading Tips. Click here to use my Free Reading Lessons for All Candidates
  • To understand GT writing (both task 1 and task 2), see all the tips and information listed below.

This page will explain both writing task 1 differences and writing task 2 differences.

IELTS GT Differences for Writing Task 1

General training students will need to write a letter for writing task 1 but academic students will need to write a report.

  • GT Writing Task 1 = Letters: Formal, informal and semi-formal
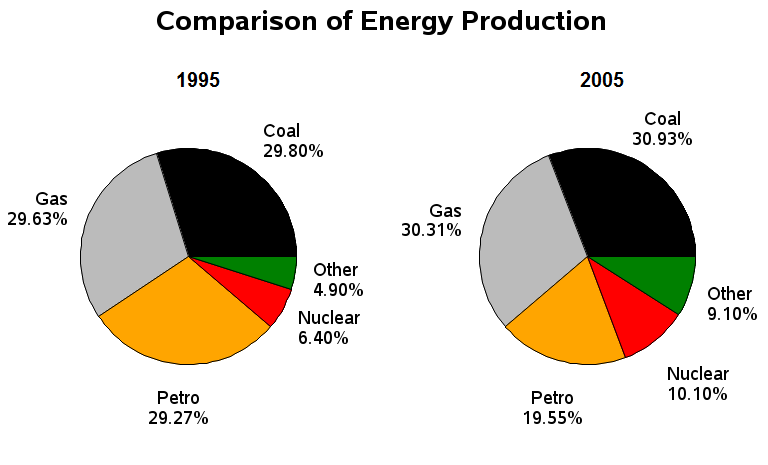
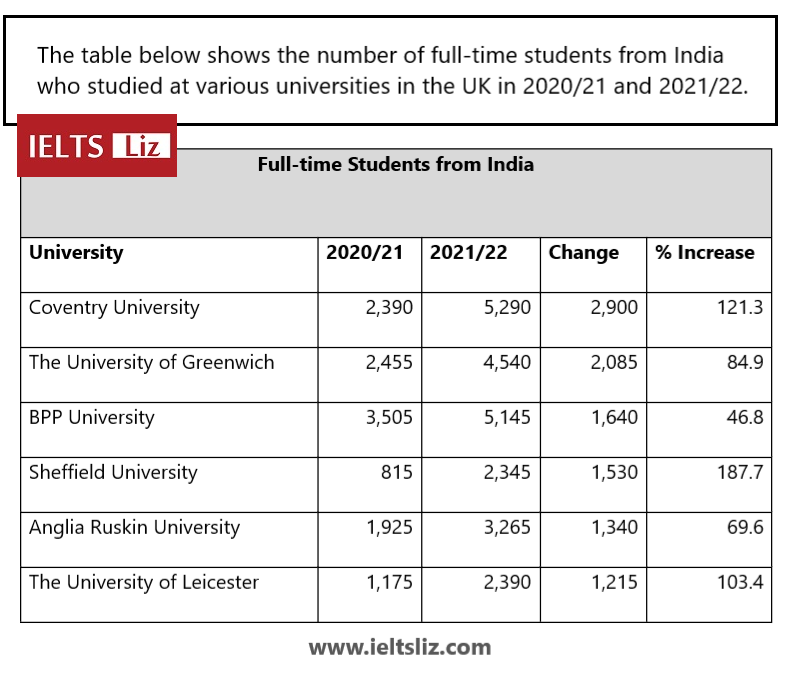
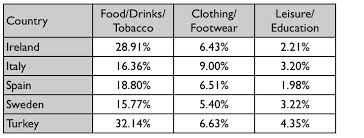
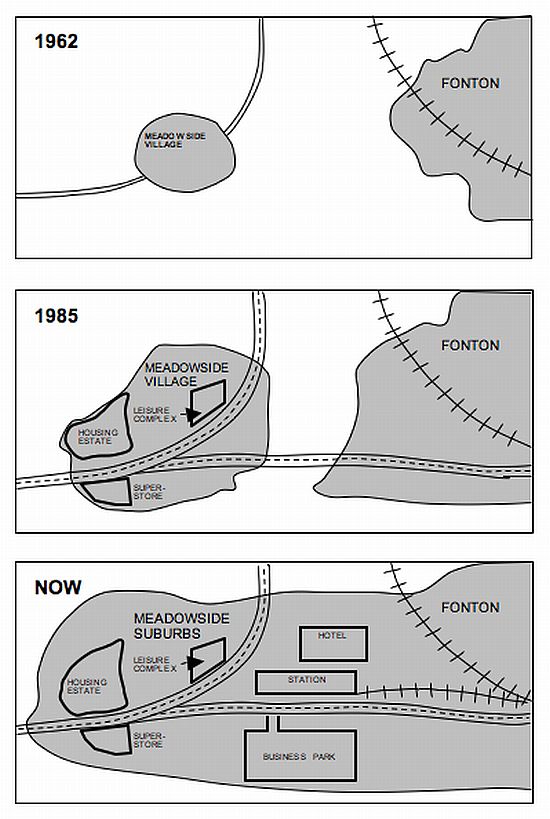
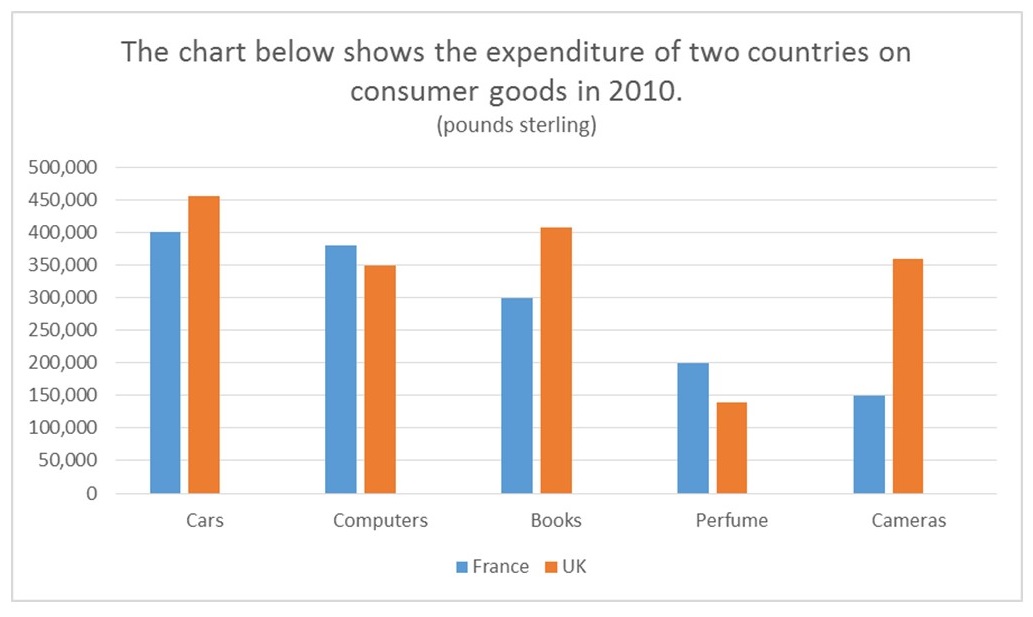
  • Academic Writing Task 1 = Report: table, pie chart, bar chart, line graph etc.

This means writing task 1 is completely different for GT candidates. GT candidates do NOT get charts, they are given letters only. See the information below:

General Training Writing Task 1 Letter

Use the following 10 tips and links to ensure you understand GT letters properly

  1. Candidates are required to write a letter which can be formal, semi-formal or informal.
  2. A list of points is given for the letter as well as the aim. It is your task to make sure your letter covers all points with a clear aim.
  3. Pay attention to opening lines, closing statements, paragraphs etc.
  4. You also need to pay attention to style and tone depending on whether the letter is formal or informal.
  5. Get to know the scoring for task 1 – see below. Remember, task 1 is worth only 33% of your writing marks.
  6. You must write over 150 words. But it is recommend not to write over 200 words.
  7. It is recommended to take no more than 20 minutes for this task. It is up to you to manage the one hour given for the whole writing test.
  8. GT students are NOT asked to write a report on a chart or graph.
  9. Sample Practice Letters for GT Students
  10. MUST READ: Essential Tips for IELTS GT Letters

Academic Task 1 Report

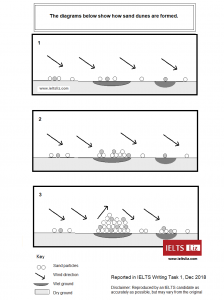
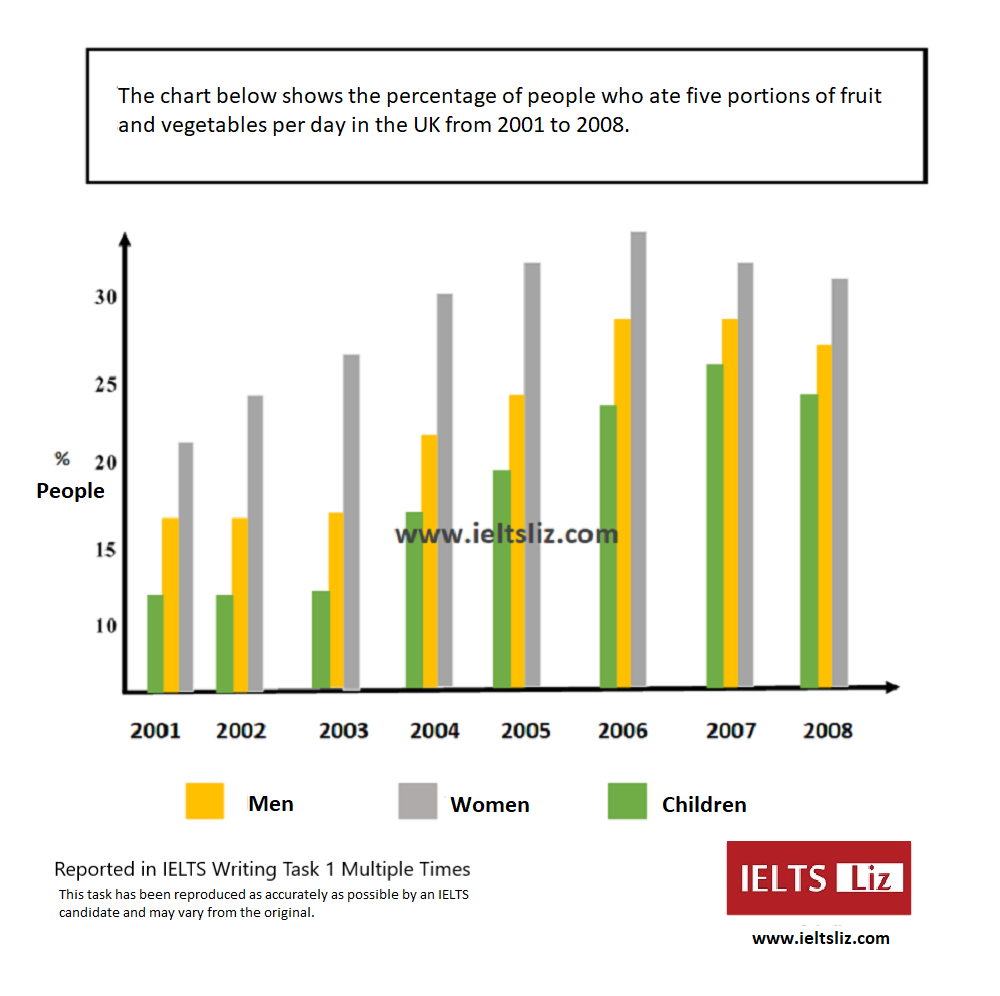
  • Students must analyse a chart, graph, table, map or diagram.
  • Students must highlight key features and present data or information.
  • Students must write over 150 words.
  • It is recommended to take no more than 20 minutes for this.
  • IELTS Sample Academic Charts

IELTS Writing Task 1 Scoring

There are four marking criteria for IELTS writing task 1.

Only one criterion is different for GT students.

  • Task Achievement General Training: This refers to using the appropriate tone and also purpose. It also relates to the word count.
  • Task Achievement Academic: This is about presenting key features, having an overview and accurate information. This also relates to the word count.
  • Coherence and Cohesion: This is the same for both GT and Academic. It is based on organisation of information, paragraphing and linking devices.
  • Lexical Resource (Vocabulary): This is marked using the same band scores for both GT and Academic. This is about using appropriate language, using collocations and the number of errors made.
  • Grammar: This is also marked using the same band scores for both GT and Academic. This is about using a range of grammar structures and tenses, punctuation and the number of errors made.

Each criterion is 25% of your total marks for writing task 1. The scoring is the same as the Academic Writing Task 1 test and used the same Band Score Descriptors, which you can find on IELTS.org. However, there is slight differences in aims with Task Achievement and that is shows in the descriptors.

IELTS GT Differences for Writing Task 2

There are only minimal differences between IELTS general training writing task 2 and the academic task 2. GT candidates can use all my free writing task 2 lessons to prepare. Click here: Free Writing Task 2 Tips & Model Essays. You can also benefit from my advanced lessons and e-books which you can find in my online store: Liz’s Store

Below is a list of the minor differences and similarities between the essays.

1. Essay Question Difficulty

One difference is that the essay question for the General Training writing task 2 is often easier. It is written in a way that makes the issues clearly and easier to understand. Here’s a sample of a GT essay question and an academic essay question.

GT Essay Question Sample

Some students travel abroad for one year before starting university.

What are the advantages and disadvantages of doing this?

Academic Essay Question Sample

Some people think that space exploration is a waste of money and the funds should be relocated to other more needed areas.

To what extent do you agree?

* Please note that it is still possible to get the education essay question in the academic test.

2. Topics for Essays

Another slight difference is that the topic giving for the IELTS general training essay question is a more common topic, such as family, society, TV, schools, communication etc. However, in the academic test, there is a wider range including space exploration. Even so, it is best for GT candidates to prepare all topics because the topic of space exploration could come in the speaking test.

3. Essay types for General Training

The types of essays are the same for both general training and academic IELTS papers. You could get an opinion essay, a discussion essay, an advantage disadvantage essay, a solution essay or a direct question essay. At the bottom of the 100 IELTS essay questions page, you will find some practice essays for each type. And on the writing task 2 page, you will find model essays for each type. All this is suitable for both GT and academic students.

4. Marking & Scoring

The marking criteria and band scores are the same for both GT and academic students in writing 2. Here is a link to learn about the band scores for writing task 2 from band 5 to 8. There is only one scoring for GT Writing Task 2 and Academic Writing Task 2 with no differences at all.

5. IELTS GT Essay Writing Techniques

Another similarity is the technique for essay writing. It is the same for both GT and academic essays. Students for both the GT test and academic test will study from the same methods, tips and advice for IELTS essay writing.

This means all writing task 2 lessons on this blog are suitable for both GT and academic IELTS students. See here: IELTS Writing Task 2 Tips, Model Essays and Free Video Lessons

6. Essay Length and Timing

The length of the GT essay is over 250 words which is the same as the academic essay. Likewise, 40 minutes is the recommended length of time for both types of essays.

Using the Official Writing Answer Sheet

Students taking the general training or academic writing test, must select the right box to tick on the official writing answer sheet in the test. Please watch this lesson about filling in the official IELTS writing answer sheet. It explains about selecting the right box for either general training or academic writing.

Recommended IELTS Tips

IELTS GT Writing Task 1 Letter: Essential Tips

IELTS Writing Task 2 Lessons, Tips & Model Essays

FREE SUBSCRIBE

Subscribe to get new lessons & tips by email for free.

.

IELTS Writing Task 1: Pie Chart Model Score 9

How to compare two pie charts in IELTS writing task 1. This sample answer illustrates the method of organising the report as well as useful language and sentence structures to get a band score 9.

IELTS Pie Charts

The pie charts below show the comparison of different kinds of energy production of France in two years.

ielts pie chart comparison

Source: Above pie charts not created by IELTS Liz.

Pie Chart Sample Answer

The two pie charts illustrate the proportion of five sources of energy production (coal, gas, nuclear, petrol and other sources) in France in two years (1995 and 2005). 

Overall, in both years coal and gas accounted for over half of all energy production, while the least was other energy sources. There was only a very minimal increase in production from gas and coal, whereas nuclear and other sources almost doubled. Petrol was the only energy source to decrease over the period.

Energy produced by coal comprised of 29.80% in 1995 and by 2005, it increased by about 1% to 30.9%. Likewise, the amount of energy generated by gas went up by approximately 1% from 29.63% in the first year to 30.1% by the final year. The use of nuclear power rose significantly from 6.40% in 1995 to 10.10% in 2005. Other sources of energy production accounted for 4.90% but then climbed to 9.10%.

Petrol, on the other hand, produced 29.27% of all energy in 1995 but 10 years later only 19.55% of energy came from this source. 

Words = 177

IELTS Pie Chart Tips

  • Introduction paragraph should introduce all aspects of the task.
  • The overview must contain all key features of all pie charts. This is the most important paragraph and should not be only one sentence. You must identify the key features of both charts and present them as an overview. You are being marked on the content of this paragraph.
  • Always highlight the largest and smallest proportions in the overview. 
  • Note whether the pie charts show change over time or comparison of categories divided by gender or in a similar way. Not all pie charts are the same. Depending on the information given, you’ll use different language and organise things differently.
  • If there are two pie charts in different time periods, then you must highlight the key changes / trends.
  • Use pie chart language – accounts for / comprises of / represents.
  • The phrase “Units are measured in …” should be used when the units have not been stated in the previous sentence.

RECOMMENDED FOR YOU

Click below:

FREE SUBSCRIBE

Subscribe to get new lessons & tips by email.

.

IELTS Table Band Score 9 Model Answers with Tips

Below is an IELTS table with model answer for Writing task 1. The tables below are typical of what you will get in your IELTS test. The model answers help you understand how to structure your table writing and organise data into paragraphs. Getting lost in too many numbers is the biggest challenge for IELTS tables. All model answers are estimated at band 9 and are written as a safe guide to learn from for all band scores.

How to Approach IELTS Table Questions

Useful strategies for IELTS Tables in Writing Task 1: Below are useful steps to ensure that you approach your IELTS table correctly. Try not to get lost in detail and instead look for patterns, similarities and differences to group information together.

  1. Analyse the key information in each category.
    • look for key features (highs/lows/usual data/ changes)
  2. Think about grouping information and categories together
    • if numbers are all below 5%, group them together as one but avoid writing them as a list and instead refer to them collectively
        • group information together with similar trends is essential for an IELTS table because of the volume of data given.
        • you get a lower score if you give too many small details
        • you get a lower score if you miss out information
    • if a number or a category is unusually high, single it out as an individual feature
  3. Plan your paragraphs and content. Each paragraph has a unique and clear function. Use the model table answers above to review them.
    1. Introduction
    2. Overview
    3. Body Paragraph 1
    4. Body Paragraph 2
    5. Body Paragraph 3 (not usual but possible at times)
  4. The introduction should be short and factual.
    1. For a free video lesson, click here: How to Write an Introduction for Writing Task 1
  5. The overview is the most important paragraph. Make sure it contains all key features for a high score.
  6. Divide your body into paragraphs.
    1. In most tables, you will have categories along the top and the side. You must decide the best way to divide categories into body paragraphs. Always choose the most logical.
    2. The time to give data in the body paragraph. Each statement must be supported with numbers from the table given. If you don’t give numbers, you’ll get a lower score for Task Achievement which counts for 25% of your marks.
    3. You don’t have to give all details. You can group details together by giving averages or ranges.
    4. Be selective. Don’t put too many details in your report.
  7. Make sure you write over 150 words but aim for less than 200.
  8. Try to avoid being repetitive with your sentence structures.
  9. Pay attention to what type of information the table gives (static figures or changes over a period of time). This will help you decide what kind of language to use.
  10. Do not try to paraphrase all words, all the time. This leads to vocabulary mistakes. Choose wisely which words to change and which to keep the same.
  11. All information and language should be accurate for a high score

IELTS Table Model Answers

IELTS Table: Question 1

As you see, this IELTS table shows  change over two time periods with four categories in total.

IELTS Table

IELTS Table Model Answer 1

The table gives information about how many full-time students coming from India studied in six British universities in two academic years (2020/21 and 2021/22) as well as the change in numbers and percentage increase.

Overall, the greatest increase in Indian students could be seen in Sheffield University, while BBP University showed the lowest increase over the two years. The university with the most students from India was BBP University in the first year and Coventry University in the second year.

Sheffield University saw a dramatic rise of 187.7% in India students reaching 2,345 in 2021/22. Likewise, the number also climbed considerably for Coventry University by 2,900 students (121.3%) to hit 5,290 students in 2021/22. Another significant increase was seen in Leicester University from 1,175 to 2,390 students, a rise of 103.4%.

All other universities saw an increase of under 100% in the number of Indian students over from 2020/21 to 2021/22. The number of students going to University or Greenwich and Anglia Ruskin University rose by 2,085 students (84.9%) and 1,340 (69.6%) respectively. Regarding BBP University, the number of students remained high in both years at 3,505 and 5,145, which was a growth of only 46.8%.

IELTS Table: Question 2

This IELTS table is slightly easier because it contains less data. You can also see trends for each category more easily.

 The table below gives information about consumer spending on different items in five different countries in 2002.

IELTS Table Question Writing Task 1

(Source: IELTS Cambridge English Test Book

IELTS Table Model Answer 2

The table illustrates the proportion of consumer expenditure in Ireland, Italy, Spain, Sweden and Turkey on three types of consumer goods in 2002.

Overall, the category of consumer goods that all countries spent most on was food, drinks and tobacco, which was three times higher than on the other types of goods. The lowest spending could be seen in the category of leisure and education in all five countries. The outlay of Turkey was generally higher than the other four countries.

In terms of food, drinks and tobacco, Turkey spent the most at 32.14%. The expenditure of Ireland was also high (28.91%) compared to Sweden which spent the least (15.77%). Spain and Italy spent 18.80% and 16.36% respectively. On the other hand, the lowest expenditure was on leisure and education which accounted for under 5% in all countries. Turkey spent most on these items at just 4.35% of their national expenditure which is around double that of Spain (1.98%).

Clothing and footwear was the third category of consumer goods and outlays for those items were between 9% in Italy and 5.40% in Sweden.  The national spending in this area for the remaining countries averaged around 6.5%.

Note: in most writing task 1 reports, body paragraphs do not need to be a similar length. In report writing, it is common to very some long paragraphs and others quite short. Tables are no different to other task 1 charts.

RECOMMENDED FOR YOU IN WRITING TASK 1:

FREE SUBSCRIBE

Subscribe to get new lessons & tips by email.

.

IELTS Writing Maps: Model Answer, Tips & Vocabulary

Below is an IELTS Writing Task 1 Map Model Answer with Great Tips and also Vocabulary. The IELTS Map Model Answer is Band Score 9 and helps you see the structure, key features and language. The IELTS Map question is a comparison of three maps in different time periods for the academic writing task 1. 

TIPS FOR IELTS MAPS: WRITING Task 1

Below are useful tips and techniques for writing a high band score writing task 1 map.

Types of IELTS Maps

There are a variety of maps that you can get in IELTS Writing Task 1 test:

  1. Changes in Towns

These types of maps focus on the expansion and layout of towns with features such as roads, buildings, land and other features of a town or city. It is most common to be given two maps, but occasionally (like in the model below) you could get three maps.

2. Changes in a Resort

This is about a holiday area which usually has different features than a town. There might be facilities such as swimming pools, nature hikes, hotels, beaches and water features. These types of tasks often compare current resorts with a future resort. However, future maps could appear as any type of map. 

3. Places with Multiple Buildings and Features

Typical examples of this type of map is a school, university or hospital.

This type of map covers an area of ground containing different buildings that serve different functions. The layout is different to a town and the facilities relate only to the function of the company/institution.

4. Floor Plans 

You could be given a floor plan which means it is the layout of a building on the inside showing all the rooms. Floor plans often show a past layout with a future plan to expand and alter rooms. Unlike the above maps, this one is about rooms and the functions of rooms. For example a room might have been a study in the past but there are plans to expand it and use it as a kitchen/diner. 

Grammar Tenses for Map Writing

Always check the date on the maps.:

  1. if the map is dated in the past, you must use past tense. For example, “The hospital was located to the north side of the town”
  2. if the map shows a future plan, you must use future forms, such as “it will be extended and will no longer be used as an office, but instead used as a reception room.”. 
  3. if the map is dated as “Present” or “Now”, you would use the present tense.
  4. If there is a comparison of dates, you must be flexible with the tenses in your sentences: “the office was located on the ground floor but in the future it will be moved to the first floor.”
  5. You will also notice that the passive voice is sometimes used for map reports for writing task 1.

Map KEYS and Compass Points

Sometimes your map will have a key. This is a a box of information in the map that tells you what things are called. You should pay attention to it and use that language.

Always check if the map shows north. For towns and other areas, you can always presume that north is directly up. It is important to know: north, south, east and west. Watch the video below for map vocabulary.

Structure & Paragraphing for IELTS Map Writing

Structure of Report

  1. Introduction – paraphrasing the description given and adding more required information
  2. Overview – collecting all key features into one paragraph
  3. Body Paragraph 1 – details of the maps
  4. Body Paragraph 2 – details of the maps
  5. Body Paragraph 3 – details of the maps (optional)

Overview: Key Features

All overviews in writing task 1 are critical to your score and are the most important paragraph. They must contain all key features. So, you need to pay attention to what changes and what stays the same. This what you highlight in your overview paragraph. The biggest mistake people make is writing only one sentence for their overview because they think it isn’t important.

Body Paragraphs

Your division of information for body paragraphs will depend on what your maps show. You might divide the information into paragraphs based in different time periods. But if you do that, you won’t be comparing. Or you could divide information based on what changes and what doesn’t. Body paragraph organisation must be logical whatever your choice.

IELTS MAP WRITING TASK 1: Model Answer 

The maps below show the changes that have taken place in Meadowside village and Fonton, a neighbouring town, since 1962.

IELTS Map Comparison for Writing Task 1

Source: Map above not produced by IELTS Liz.

IELTS Map Comparison Model Answer

The three maps illustrate how Meadowside village and Fonton, which is a nearby town, have developed from 1962 to the present.

Overall, both Fonton and Meadowside village increased in size over the years until they eventually merged together, at which point Meadowside became a suburb. Furthermore, there have been significant changes to infrastructure, housing and facilities over the period given.

In 1962, both Meadowside and Fonton were completely separate with no roads or rail connecting them. While Fonton had a railway line running to the north, Meadowside, located to the west of Fonton, only had a small road from the west.

By 1985, Meadowside had expanded and the small road had become a main road. A further main road had been built to connect the village to Fonton. Within Meadowside, a superstore, leisure complex and housing estate had been developed. By this time, Fonton had also grown in size. 

Currently, Meadowside is known as Meadowside Suburbs after joining with Fonton. Between both places, a hotel, station and business park have been built on either side of the railway line.

COMMENTS about MODEL ANSWER:

  1. It isn’t often that you will have three body paragraphs for your IELTS Writing Task 1 report. But this maps has three time periods so it makes sense to have these body paragraphs.
  2. It could be possible to divide the information of body paragraphs into:
    • Body Paragraph 1 – roads and railway
    • Body Paragraph 2 – land and buildings
    • There is no right or wrong way to organise information into body paragraphs. You are being marked on being logical in how you organise information. If it lacks logic, you get a lower score. Your organisation also needs to help highlight key features which means deciding key features during your planning state is important because it will influence your paragraphing.
  3. The length of all writing task 1 should be between 170 and 190 words. A longer report will be marked down for not selecting features and getting lost in detail. A shorter report will be marked for not having enough information. To learn about the marking criteria that the examiner will assess you on, click here: Writing Task 1 Band Scores Explained

Vocabulary for Maps Video

The map shown in this lesson was designed for teaching vocabulary – it not an IELTS map task.

RECOMMENDED FOR YOU

FREE SUBSCRIBE

Subscribe to get new lessons & tips by email.

.

IELTS Model Bar Chart Band Score 9

The model answer below is for an IELTS bar chart in writing task 1 of the academic paper. This model answer comes from the video tutorial I made, see the following link: Free Video Tutorial:  How to Describe an IELTS bar chart

IELTS Bar Chart

Bar Chart Model

Source: Bar chart above from unknown source.

IELTS Bar Chart Sample Answer

The chart illustrates the amount of money spent on five consumer goods (cars, computers, books, perfume and cameras) in France and the UK in 2010. Units are measured in pounds sterling.

Overall, the UK spent more money on consumer goods than France in the period given. Both the British and the French spent most of their money on cars whereas the least amount of money was spent on perfume in the UK compared to cameras in France. Furthermore, the most significant difference in expenditure between the two countries was on cameras.

In terms of cars, people in the UK spent about £450,000 on this as opposed to the French at £400,000. Similarly, the British expenditure was higher on books than the French (around £400,000 and £300,000 respectively). In the UK, expenditure on cameras (just over £350,000) was over double that of France, which was only £150,000.

On the other hand, the amount of money paid out on the remaining goods was higher in France. Above £350,000 was spent by the French on computers which was slightly more than the British who spent exactly £350,000. Neither of the countries spent much on perfume which accounted for £200,000 of expenditure in France but under £150,000 in the UK.

EXAMINER COMMENTS: The report has been organised into logical paragraphs with flexible use of linking. The overview is very clear with key features well highlighted. Accurate data is used to support sentences in the body paragraphs. There is a range of complex structures and vocabulary which are all flexibly used. This is an estimated band score 9 writing task 1 report for the academic paper. As you can see, the structure and information are presented in a way that is easy to understand, while the language offers complexity. 

RECOMMENDED FOR YOU FOR WRITING TASK 1:

FREE SUBSCRIBE

Subscribe to get new lessons & tips by email.

.

.

IELTS Sand Dunes Diagram Writing Task 1

The diagram below is an IELTS writing task 1 diagram about sand dune formation. This appeared in the IELTS test in December, 2018 (academic paper).

This diagram was particularly challenging because of the similarity in the three diagrams and the lack of words given. People were concerned about paraphrasing and repeating vocabulary. There is a link to download this in pdf below the diagram.

IELTS Diagram: Sand Dune Formation 2018

The diagram has not been published by IELTS, it was recreated by an IELTS candidate and also confirmed by another. This means it might vary from the actual diagram in the test but the essentials will be the same and it will still provide much needed practice with such diagrams.

Sand Dune Diagram Model Answer

The diagrams illustrate the formation of a sand dune from sand particles. Overall, the three stages of formation show that sand particles are driven by the wind over dry ground to gather on wet ground where they collect and create sand dunes.

The first diagram shows how sand particles are blown by the wind over the dry sandy ground and two areas of wet ground. This is then followed by the second diagram in which it can be seen that as particles of sand continue to be carried by the wind along the ground, some of the particles start to adhere to the first patch of wet ground in separate piles.

The sand particles which have been transported by the wind, as illustrated in the final diagram, eventually gather en masse over the area of wet ground, piling one on top of the other until they form a sand dune. The accumulation of so many sand particles is so large that the dunes, once formed, can deflect the wind, forcing it up one side of the dune and down the other. As this happens, particles of sand start gathering and piling up in the next area of wet ground.

Tips

  1. Your overview must be clear and contain all key features. It is the most important statement in your whole task.
  2. The overview contains key features and summarises the whole diagram into one statement. Take the keywords and create on long statement which explains the diagram.
  3. The overview can be put together with the introduction in one paragraph, but it still forms a statement on its own. Do not split your overview. You cannot have an overview and another general statement in a different part of the report. You need to collect all summarising statements together and write them as one overview.
  4. If you only state that there are three stages, this would be considered a limited overview which is a features of band 6 Task Achievement. You need to add more than just a number of stages.
  5. You only paraphrase where possible. Some words cannot be paraphrased, such as sand, dune, wind etc. Words such as “blown by the wind” = “transported by the wind” & “carried by the wind”. Choose which words you will and won’t paraphrase.
  6. You should be using a mixture of active and passive voice to describe a diagram or process.
  7. Even though there are three diagrams, does not mean you need three body paragraphs. Be flexible.
  8. The word count of this writing is 199. You do not need to write that much, but do make sure you write over 150 words.
  9. Use linking and sequencing words: overall, followed by, as illustrated, eventually, as this happens

I hope you found it useful to see this diagram, model answer and tips 🙂

All the best

Liz

Get my free lessons by email

Subscribe for free to get my new IELTS lessons sent to your email inbox.


IELTS Line Graph Vocabulary

Essential vocabulary to describe an IELTS writing task 1 line graph. To get a good band score you must show the examiner a range of different words to show upward and downward trends as well as key features. IELTS line graphs show change over a period of time and you must vary your language and vocabulary when you write your report.

Important: This page is about line graphs. But it is possible to use some of this language with bar charts that show change over time as well as tables or pie charts that show change over time.

This page contains:

      1. VERBS & NOUNS WITH PRACTICE LESSON
      2. ADVERBS & ADJECTIVES with PRACTICE LESSONS
      3. TIME PHRASES
      4. LINK TO MODEL LINE GRAPH

1. IELTS Line Graph Verbs & Nouns

Below are lists of verbs and nouns that can be used to describe a line graph in IELTS writing task 1. You should alter your sentences to use the noun form of the word and the verb form of the word. 

  • Question: Can you use the verb “increase” and the noun “an increase” in the same writing or is it considered repetition of words? 
  • Answer: You can definitely use the verb and noun form of the same word. This shows great flexibility that you can change word form. Your task is to show the examiner this flexibility. You will use these verbs and nouns in all line graphs because all line graphs show upward and downward trends.

Tips: You will use the above words according to what is shown in the line graph you are given. Fluctuations are when a line goes up and down repeatedly. A dip is when the line goes down but then returns to its previous point. Nearly all line graphs will have a peak, which means the highest point. Each line only has one peak, which is good to highlight in your report. To rocket and soar are both verbs that describe extremely dramatic increases. Never use these two verbs unless the increase truly is dramatic.

Mistakes when using words will affect your band score. This includes spelling.

  • Band 6 = some vocabulary errors.
  • Band 7 = few vocabulary errors.

2. Practice with Nouns and Verbs

Fill in the gaps using the vocabulary above. Look at the graph below and then fill in the gaps in the sentences 1-5 below.

IELTS Line Graph Vocabulary

  • IELTS Line graphs never have one line, except occasionally in a multiple task. So, this isn’t a line graph to practice with for a full model answer. For sample charts, click here: Sample Practice Charts

QUESTIONS: 1-5

Fill in the gaps with the correct nouns and verbs. You should use no more than two words for each gap.

The number of reported cases of influenza began at 40 in 1985 after which the figure (1). …………………… steadily to reach about 55 in 1987. In 1988, there was a (2) …………. in the number to below 50 before (3) ……………. to reach a (4) …………  (5) ……….. approximately 75 in 1991. After that date, the figure dropped to about 55 in the final year.

ANSWERS

Click below to reveal the answers:

Answers
  1. rose / increased / climbed / grew / went up
  2. a fall / a decline / a drop / a dip / a decrease
  3. climbing / increasing / rising / going up / growing
  4. peak
  5. of

NOTICE: to peak at / a peak of (the preposition changes when you use the verb or noun)

.

3. Line Graph Adverbs & Adjectives

Below are useful adverbs and adjectives to describe change.

Adjective Definition Exercise: 

What is the real meaning of these adjectives and adverbs? Below you will find a table with adjectives and meanings. Match the adjectives with the correct meaning.

1) rapid / steep / dramaticA) the change took a long time
2) marginal / minimalB) a change that went from very low to very high
3) steady / gradual C) a change that went from about 50 to 100 out of 1,000
4) considerable / significantD) a big change that happened over a very short period of time

ANSWERS

Click below to reveal answers:

Answers
  1. D
  2. C
  3. A
  4. B

.

4. Time Expressions for Periods of Change

IELTS line graphs show change over  a period of time. Below are some expressions to help you describe the passing of time without too much repetition.

Time phrases:

steady / gradual = these words do not show how much change, but rather that it took a long time for the change

  • over the next three days
  • three days later
  • after three days
  • over the following three days
  • the next three days show
  • from…to… / between … and…
  • the last year / the final year
  • the first year / initially
  • over the period / given period / period given
  • at the beginning of the period
  • at the end of the period
  • over a ten-year period
    • you must have an article (a/the)
    • the word year has no s
    • ten-year has a hyphen

RECOMMENDED FOR YOU:

IELTS LINE GRAPH MODEL ANSWER

Multiple Task: Line Graph & Bar Chart Model

ALL MODEL ANSWERS & TIPS FOR WRITING TASK 1

I hope you found this page useful. All the best, Liz

FREE SUBSCRIBE

Subscribe to get new lessons & tips by email.

.

IELTS Model Answer Bar Chart Writing Task 1

IELTS bar chart model answer for writing task 1. This IELTS bar chart appeared in two different years in the IELTS writing task 1 test and will likely appear again. The model answer below will help you understand how to organise your ideas and support your statements with data. Also check the 10 useful tips below to help you understand the model answer better.

IELTS Bar Chart Sample Question

IELTS Bar Chart for writing task 1 with sample answer

IELTS Model Answer for Bar Chart

The bar chart illustrates the proportion of women, men and children consuming five servings of fruit and vegetables each day in 8 years from 2001 to 2008 in the UK.

Overall, it can be seen that the highest percentage of all people consuming fruit and vegetables was women, while children consistently accounted for the lowest proportion. Furthermore, a significant increase in the proportion of people eating these food items can be seen over the period given.

The percentage of women who ate fruit and vegetables started at just over 20% in 2001. This figure then rose steadily to reach a peak of almost 35% in 2006, before falling slightly to 30% in the final year.

In terms of men and children eating fruit and vegetables, the rate remained relatively stable in the first three years (about 17% and 12% respectively). From this point, the proportion of men climbed gradually to peak at about 27% in both 2006 and 2007, after which it dropped to about 26%. A similar growth in the figure for children was evident reaching 25% in 2007 and around 24% in the final year.

Tips for Analysing the Model Answer:

  1. Paraphrasing does not need to be complicated. Not all words can be changed all the time. Choose which words you will and won’t change. Trying to paraphrase too often will result in too many errors and a lower score.
  2. Highlight highs, lows and trends in your overview where possible.
  3. Make sure statements in your body paragraph are supported by data.
  4. Make sure paragraphs are easy to see.
  5. Remember this is a report, not an essay
  6. Look at the logical organisation of information in the model answer above. It is easy to read and not confusing. If your report is confusing to read because you jump about with information, it is a bad report. All reports should be logical and clear.
  7. Check the linking words used.
  8. Note the variation in sentence structures.
  9. Don’t overload your report with too many small details – be selective.
  10. Aim for around 170-190 words. This model answer is 184 words in length. You do not need to write your word count on your test paper.

GT Candidates: You will only have to write a letter for your writing task 1 (GT Writing )

RECOMMENDED FOR YOU

Click Below:

ALL MODEL ANSWERS, LESSONS & TIPS FOR WRITING TASK 1

Writing Task 1 Band Scores Explained

FREE SUBSCRIBE

Subscribe to get new lessons & tips by email.

.

error: Content is protected !!