The IELTS model answer below is for a recent IELTS writing task 1 which was reported in early 2016. The two pie charts and bar chart are illustrated beneath the report. Further down the page, you will also find examiner comments and a download link for this model answer and task. Also note the useful links provided for more IELTS writing task 1 lessons. This is for the IELTS writing task 1 academic test.
IELTS Model Answer, Reported 2016
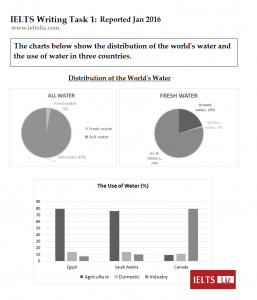
The pie charts give information about how the world’s water is distributed, whereas the bar chart illustrates the percentage of water used in agriculture, domestic use and industry in three countries (Egypt, Saudi Arabia and Canada).
Overall, salt water makes up an overwhelming majority of the world’s water. Fresh water is made up of mainly water from ice and glaciers. While most water in Egypt and Saudi Arabia is used for agriculture, in Canada it is predominantly used for industry.
The pie charts show that 97% of global water is salt water compared to a mere 3% which is fresh water. Water from ice and glaciers accounts for 79% of all fresh water as opposed to ground water and surface water (20% and 1% respectively).
In terms of the use of water, both Egypt and Saudi Arabia use almost 80% of their water for agriculture in comparison to domestic usage and industry which account for approximately 15% and 10% respectively. The reverse is seen in Canada where only 10% of water is used for agriculture and domestic purposes in contrast to industry, which uses 80% of water in Canada.
Words = 189
Download this writing task 1 with model answer: IELTS Writing Task 1 Charts & Model 2016
Examiner Comments:
The information is well organised into logical paragraphs. The overview paragraph contains the key features of all charts. Information is accurate and no irrelevant information is given. There is a flexible range of linking devices for showing comparisons. Vocabulary is well used and this report contains complex sentence structures.
Recommended
- How to describe a bar chart: free video lesson
- Conclusion or Overview?: free video lesson
- IELTS Writing Task 1 Band Score Tips
- All writing task 1 tips, answers and lessons
- Recent IELTS Exam Questions


Hi Liz,
First of all a big thank you for creating this platform of free resources. Its really helpful. I used them when i first gave IELTS in 2020 GT, but i am now appearing for IELTS Academic. I have a query below if you can help me i will really appreciate as i have tried to find out from google and other resources online but cant seem to get an accurate answer:
So my query is regarding the use of comma which is part of grammatical range and accuracy. I understand that for WT1 Academic report that when we use “WHILE” or “WHEREAS” in a sentence and it appears in the second part of a sentence we usually place a comma before it as it shows comparison.
But i am not clear if the same applies to the terms “AS OPPOSED TO” or “AS COMPARED TO” or “IN COMPARISON” which are again often used in report writing. What are the rules for these? Are we supposed to place a comma before these terms when they appear in the second part of a sentence?
I can see in your this model answer you havent used any commas with these words (as opposed to, as compared to) specifically the below sentences; will really appreciate your guidance on this:
The pie charts show that 97% of global water is salt water compared to a mere 3% which is fresh water.
Water from ice and glaciers accounts for 79% of all fresh water as opposed to ground water and surface water (20% and 1% respectively).
Thank you in advance.
“as opposed to” and “in comparison to” and “compared to” both have prepositions at the end and these do not require a comma. The words “in comparison” use a comma, the same as “while” or “whereas”.
Dear Liz,
When to use favourite VS most favourite?
What’s the difference?
Thanks!
The words “most favourite” actually don’t exist in English. It is grammatically incorrect to say it. You can only ever say “favourite”.
Hi Liz, please help me grade the below writing task 1. much thanks!
The pie charts illustrates the distribution of water in the world while the bar chart shows the percentage of use of water in three different countries (Egypt, Saudi Arabia and Canada) in three different sectors (Agriculture, Domestic and Industry) in January 2016. Overall, it can be seen that salt water accounted the largest source of water available in the world. Also, Egypt and Saudi Arabia used water mainly for agriculture whereas Canada used in the industry sector.
In terms of entire distribution of water, the fresh water constituted only for just 3% while salt water constitute for 97%. Ice and glaciers accounted for the largest amount of water in fresh water category about 79% while ground water and surface water accounted for 20% and 1% respectively.
Coming to the bar chart, Egypt and Saudi Arabia used water mainly in the agriculture sector about 75%-80%. The use of water in the domestic and industry sectors ranged approximately at 15% and 9%. On the other hand, Canada used water in the opposite way by using water mainly in the industry sector at 80% while the other two sectors ranged at around 10% only.
The above-given pie chart represents the distribution of water in two different categories namely (Freshwater, and saltwater). Meanwhile, the bar graph illustrated the usage of water in three other countries such as Canada, Egypt, and Saudi Arabia and according to three categorical restraints (Agriculture, domestic & industry)
Overall, it is evident from the bar graph that most of the water in the countries of Egypt and Saudi Arabia is taken by agricultural land whereas, in Canada, most of the water is consumed by industries.
Firstly, in the pie chart, all water is divided into two major types which are salt water that is taken 97 % of all land, and freshwater 3 % only. It is also evident from the second pie chart that fresh water is mainly sliced into three parts: ice & glaciers 79 %, 20 % by groundwater, and only 1% by the surface.
In the end, for the agriculture portion, Egypt used the water 80 % while Saudi used a little less than 78 % and this figure dropped sharply to 10 % in Canada while only 12 % of water usage was seen for domestic purposes in Egypt, Saudi Arabia, and Canada whereas in the industrial purposes has 8 %, 10 % in Egypt and Saudi but it surged to 80 % in Canada.
The pie charts illustrate how water is distributed around the world and the bar chart illustrates the percentage of water used for agriculture, domestic use, and industry in three countries: Egypt, Saudi Arabia, and Canada.
Overall, the majority of water is salt water. Ice and glaciers composed most of the fresh water while ground and surface water contributes with a small fraction. Egypt and Saudi Arabia consumes most of their water for agriculture while Canada consumes most of it for industry. The consumption of water for domestic use by the three countries is almost the same.
World’s water is divided into salt water with a percentage of 97% and fresh water with a percentage of only 3%. Most of the fresh water comes from ice and glaciers with a percentage of 79%, while the other sources of fresh water are ground and surface water which account for 20% and 1%, respectively.
The usage rate of water by Egypt and Saudi Arabia for agriculture is around 80% and 75%, respectively. While the usage rate for industry by the same countries is only 8% and 10%, respectively. Both of these countries have similar rate of water consumption for domestic use (around 13%). The trend is reversed for Canada, the consumption rate is only 9% for agriculture in contrast to that of industry, which is around 80%. The usage rate for both agriculture and domestic use is nearly the same (around 10%).
The pie charts provide information about how the total water of the world is distributed, and the bar chart exhibits its usage in three nations (Egypt, Saudi Arabia and Canada).
At first glance, it can be observed that fresh water only occupies a small portion between all water, and salt water makes up the significant majority. Much of the fresh water is consolidated as ice and glaciers, while only small portions are present as ground water and surface water, respectively. Moreover, Egypt and Saudi Arabia show similar trends in water usage, with maximum usage of water in agriculture and the least usage in the industrial sectors. The reverse is true for Canada.
Upon closer look, it appears that almost the entire water content of the Earth is salty (97%). Among the remaining 3%, only 1% comprises of surface water. Ground water makes up only one-fourth of the total fresh water, which leaves more than three-quarters of the portion to ice and glaciers.
Egypt and Saudi Arabia uses their major portion (around 80%) of the water in Agriculture, while Canada uses only about one-tenth in the same sector. On the other hand, Canadians use up exactly 80% of their water to run their industries. The use of water for domestic purposes is similar (approximately 15%) for all three countries.
The pie charts give information about the distribution of the world’s water, whereas bar chart illustrates the percentage of water used in agriculture, domestic use and industry in three different countries namely Egypt, Saudi Arabia and Canada. The data is in the percentage.
Overall, from entire water most of the water is salted, moreover, majority of remaining fresh water covered by ice and glaciers. Apart from this Egypt and Saudi Arabia used highest amount of water for agriculture where Canada used lowest amount of water.
To begin with, the pie chart shows that 97% of world’s water is salt water compared to fresh water which hardly 3%. Ice and glaciers collect 79% fresh water which is more than ground and surface water (20% and 01% respectively).
Furthermore, Egypt and Saudi Arabia used almost 80% of water in agriculture and fewer amounts of water used in domestic and industry work, which account for approximately 15% and 10% respectively. On the other hand, Canada used 80% of water in industry and only 10% of water for agriculture and domestic usage.
Hai Liz,
I really appreciate the amount of free practice materials that you have uploaded in your site. Thanks a lot! I have practiced some academic writing task1 from cambridge english test series 14. But I am not a 100% confident as I don’t have anyone to proofread and correct. It would be great help if u could help. It’s from test1 writing task 1 and I have no idea how to copy the pie chart here in the dialog box. Here is my report on the chart:
The three pie charts illustrate the proportions of sodium, saturated fats and added sugars consumed by Americans during breakfast, lunch, dinner and snacks. The units are measured in percentage.
Overall, the percentage of sodium, saturated fats and sugar in a meal is the least during breakfast. There is a sharp increase in the amounts of these nutrients consumed during dinner however, during lunch the quantities consumed are almost equal. The amount of added sugars in snacks is almost double the quantity of the rest of the nutrients in a serving.
As per sodium and saturated fats, the maximum quantity is consumed during supper, which is 43% and 37% of the ,meal respectively. These nutrients are consumed in the least quantities with breakfast which is 14% of sodium and 16% of saturated fats. Lunch accounts for 29% and 26% of sodium and saturated fats intake respectively. Only 14% of sodium and 21% of saturated fats are consumed during snacks.
Levels of added sugars are the highest in snacks while for lunch and breakfast it accounts for 19% and 16% of the total nutrient intake. Added sugar intake is 23% by the Americans during dinner.
the pie chart illustrates how water was distributed in the world , whereas , the bar chart below shows how water was distruted in Egypt , Saudi Arabia and Canada.
Overall, the fresh water represented a very small proportion of all the water distributed . While , in, Egypt and Saudi Arabia water was mostly used for agricultura purposes , in Canada it was used in industry.
As it can be seen , salt water was widely distributed by the rate of 97% . The remaining 3% were fresh water. This latter was distributed in three different forms , ice and glaciers 79% , Ground water , 20% and surface 1% ;
it is obvious that Egypt and Saudi Arabia used 80% of water in agriculture .Whereas , Canada used the same proportion in industry . The domestic use of water was nearly the same in all the three countries , 10%;
Hi Liz
Thank you so much for your great work so far is been helpful to me.
Please help me check what I have written for the question above and correct me where need be.
The charts illustrates information on the distribution of water in the world and the proportion of water used for three different activities in Egypt,Saudi Arabia and canada.
Overall, Salt water accounts for the highest type of water distributed in the world when compared to fresh water which is the least. Among various kinds of fresh water distributed, ice and glaciers has the highest percentage. Most of the world’s water is used for Agricultural purposes in Both Egypt and Saudi Arabia while domestic use of water is least in the three countries given.
This two pie chart illustrates the allocation of the world’s water, and the table shows the employ of water in Egypt, Saudi Arabia, and Canada on Jan 2016.all the charts measured by percentage.
To begin with fresh water, in addition, the percentage of ice glaciers was much
more than groundwater at 79% and 20%, respectively. As well, in all water, the
percentage of salt water was much more than fresh water at 97% and 3%,
respectively. The percentage of fresh water(3%)and surface water (1%) in Jan
2016 was similar.
To moving Egypt. In Jan 2016, the percentage of the use of water in agriculture (80%) was higher than industry(7%), but in Canada, industry (80%) become more than agriculture(9%). The percentage of agriculture and domestic in Saudi Arabia were very similar in Egypt at 80% and 12%, respectively.
Focusing on Saudi Arabia, the use of water in agriculture was exactly 7 times as many as the industry at 80% and 10 %, respectively.
Overall, the most significant features on the chart are: the percentage of salt water was
higher than surface water over the period given.
Dear Ms.Liz,
In this model answer,on the second paragraph you have written “salt water makes up an….” which is in the present tense.But in the second line you have written “Fresh water is made up of…” in past tense.Why did you use two tenses.Can’t we write both in past tense “made up” Is there any difference of these two make up and made up??What is the meaning of make up of and made up of??
Thank you.
Sanjana
“is made up of” is passive voice, not past tense. It is usual to use passive voice with diagrams.
hello Liz,I have a question.In the third paragraph,”Water from ice and glaciers accounts for 79% of all fresh water as opposed to ground water and surface water(20% and 1% respectively).”Are the brackets must to be wrote?
We usually use brackets in this case.
Thanks Liz for your humble task…
I had practiced from your blog and given test in October ’15. But unfortunately I couldn’t achieve good score. Because of lack of speaking practice I was so nervous on entering the speaking venue and become total speechless in front of the examiner. I got 7 bands in reading and listening but only 5 bands in speaking and 6 bands in writing though I could write really good after practicing on your lessons on writing but don’t know what happened, otherwise I was very confident about writing in last test. My query isn’t academic writing task 1 do we need to write all points about pie charts and bar charts or table charts? As I got to write report from pie charts and a table, which I felt really lengthy on writing after considering all points. Please give idea regarding this. I am going to take ielts again to secure high score in August / September.
In writing task 1, you are marked on selecting the right detail and key features to include: https://ieltsliz.com/ielts-writing-task-1-band-scores/. For writing task 2, see my advanced lessons: http://subscriptions.viddler.com/IELTSLizStore. For speaking, see this lesson: https://ieltsliz.com/develop-your-ielts-speaking-for-free/. Also read all posts on the main pages of speaking and writing – there are over 50 to read.
Hi Liz
Could you please explain how to know which details should I describe in the body paragraphs and what key features shall I write in the overview to achieve more than 7 in task1 academic. Thank you.
Helo mam,
Just want to ask can we use word “proportion” instead of “percentage”?
Yes, it’s a good paraphrase.
Hi, Mam In most of the books for writing task in Ielts, overview is written at the end but in ur sample answers they appear after introduction. What’s the proper way of writing. Also what’s the difference between overview and conclusion.
https://ieltsliz.com/ielts-tips-conclusion-or-overview-for-writing-task-1/
https://ieltsliz.com/writing-task-1-paragraphs/
Hello liz
I need your help. I want to sit for ielts on 28 May.How can improve my listening, reading and writing within 1 month. Also I can not speak fluently, plz give me some suggestions how can I practice speaking staying at home.
Go to the main pages on this blog and start reviewing band score advice, tips, videos, etc. See this video to learn how to practice speaking at home for IELTS: https://ieltsliz.com/develop-your-ielts-speaking-for-free/
Hi, Liz. I took the exam last year 5th December. Here are my scores :
Reading 6
Writing 6
Listening 7
Speaking 8
I needed 7 in all four. I am planning to take IELTS Academic again this May. Please give me some advice on how to improve my reading and writing. Thank you very much,
See my advanced lessons for improving your writing task 2: http://subscriptions.viddler.com/IELTSLizStore and learn more about the band scores: https://ieltsliz.com/ielts-writing-task-1-band-scores/. For reading, see this page: https://ieltsliz.com/ielts-reading-tips-how-can-i-improve-my-score/
Hi
thanks a lot
could you tell me what the band score of this sample was?
Estimated at band 9
hello!! i have just 1 week for my ielts exam. how can i get good band score in this short time? can anybody suggest ?
Hi Liz firstly i would like to say thank you for helping thousands of students to achieve well in IELTS. I would also like to request if you could add the possible band score for each writing examples posted on you web page. It will help us to understand the level of writing task compared to the scores. Ex- for this above mentioned task, the examiner has given the opinion but doesn’t specify the scores. It will be helpful to know the bands given as well.
Thanks
https://ieltsliz.com/liz-notice-2015-2016/
Thanks a lot
T Liz
I will have my exam in a few days. I’d like to have an intensve course with you to reach the mark I need for master.
The only lessons currently available are my advanced writing task 2 lessons: http://subscriptions.viddler.com/IELTSLizStore
All the best
Liz
Dear Liz,
I have a query regarding.
Since IELTS is conducted by Bristish Council, the words according to US english spelling considered as mistake in writing tasks for general training?
Thanks & Regards,
Karthikeyan.
This is an international English language test – both American and UK English are accepted.
All the best
Liz
Dear Liz
Thankk you very much for your excellent guidance.I’ve got overall 8 .Your lessons were very helpful.I followed them all.
Sorry I didn’t see this earlier. Very well done getting overall band 8 !! 🙂
want to knw the answers of ielts exam which is conducted on 30 january 2016
plzzzzzzzzz help me
Thanks. mam. I am very weak about writing plz give advice me.
See my advanced lessons: http://subscriptions.viddler.com/IELTSLizStore. However, you will still need to produce accurate English language in your writing to get a high score.
All the best
Liz
Hi Liz,
Request you to provide me links for Reading and Speaking for General.
Thank you.
Thanks alot Liz. Your blog has been quite helpful. My last attempts were: Listening (5), Reading (5), Writing (7) and speaking (7.5) and overall (6) instead of 6.5. I still have challenges with reading and listening. For reading, it is time factor and for listening I lost my place and that created problem for me. Any useful tip you can give me? Simon Peters.
https://ieltsliz.com/liz-notice-2015-2016/
really helpful. thanks Liz
Thancks a lot madam Liz for your benificial lessons.
Hi Liz, Is there an updated academic word list available? How important is it to use these words in the speaking part of the exam? Do you have any suggestions to help get at least a 7. Thanks in advance, Andrea
https://ieltsliz.com/liz-notice-2015-2016/
Dear mam I try more listening test but I cannot get more than 5 ,I try from ur lesson also but I can not improve my liestening test I m fortuate mam plz can u give me a suggestion
https://ieltsliz.com/liz-notice-2015-2016/
My ielts exam is on 27feb.
I want to improve my writing and speaking.
Please provide me useful vocabulary for writing.
Thanks
Dear Jaspreet…
Pls chk again the exam date… i heard it will 28th of Feb, not 27th!!
thank you Liz))
Thankyou liz. for posting latest task. My word limit actually always exceeds whenever I get two tables or charts or bar graphs in task 1. But after reading your model answer above, I have got an idea how to make things precise. Thanks a lot.
Honey
Dear liza,
I require 6 band in each section i got 5,5 in two section 5 and 4.5 in another two i just prepared one week prepration secondly please guide me what i do to achieve my score
https://ieltsliz.com/liz-notice-2015-2016/
I got 7 band (writing) in this exam which you have shared. Your tips really helped me a lot to get this.Thanks a lot Liz.
Well done!! A strong score 🙂
Liz
This is very useful, for all IELTS candidate .particularly for me becouse my examination will be schedule for 21 April.
Thanks you very much madam Liz
hii liz..regarding the bar chart u mentioned that only 10% water is used for agriculture and domestic purpose…but in chart its clearly visible that agriculture is slightly down to 10 and domestic is over 10..can we round it and use it as approximate to 10…or any issues with it….
https://ieltsliz.com/liz-notice-2015-2016/
Can I paraphrase “fresh water” by “drinking water”? like, “Drinking water is made up of mainly water from ice and glaciers.”
https://ieltsliz.com/liz-notice-2015-2016/
Thanks for sharing useful information
Hina
Hi,
It’s useful for me because I took more than 25 minutes to complete this task. Last Friday, I got my result W-5.5, R-6, L-6, S-4.5. only a few weeks practice(self-preparation with online resources and library books) I’m happy with the result. However, I need band score 6. My next exam coming March. Thank you for this great blog and support.
Hi Liz
Is it necessary to have the paragraph with same length in task 1?
Thanks
No, you don’t need paragraphs of equal length in a report.
Liz
hi,I am sunil g.c. from Nepal.it is really usesful for me,hope this types of writting tips share regularly.
Thanks so much for sharing this ,because my ielts exams is coming up february 13
i apprecaite it so much
Good luck!!
This is very useful. Thanks indeed Miss Liz. Best regards from Sri Lanka
Hi Mam
Thanks a lot from my deep heart . It is so helpful fro me and my friends. And I am waiting your next mail.
Many thanks , it’s very informative, I love your videos bcz I found what I am looking for.
Thank you for sharing.I always find your website much more helpful.Your video sessions also very good.
Hi madam liz, thanks a lot for this writing model I was waiting for it really it’s helpful task for me.
All dear readers . I m also doing praperarion for ielts but getting difficulty in writing and listing please guide
Rakedh