IELTS Table & Pie Charts Model Answer

The IELTS table and pie chart below have been reported twice in the IELTS writing task 1 test and this task is likely to appear again.. The topic is the imports of fish to the US from various countries and the value of these imports.

Note: The writing task 1 below is a reproduction of the original IELTS task 1 by an IELTS candidate. This means details will vary from the original. Even so, it gives a great chance to practise multiple tasks.

IELTS Writing Task 1: Table & Pie Charts 

IELTS writing task 1 (academic) test. This task is slightly different to the one featured in my video (Introduction Paragraph in Writing Task 1). Note that is it about value and not cost.

Model Answer: IELTS Table & 3 Pie Charts

Instructions: The following model answer has been divided into sentences (A-H). Put them in the correct order to find a band score 9 model writing task 1 report.

A) In terms of the source of fish importation, Canada supplied the overwhelming majority in 1988 (60%) compared to China and other countries which provided only 13% and 27% respectively.

B) Regarding the table, the value of imports started at $6.57 billion in the first year, increasing to $8.52 in 1992 and reaching $10.72 in the last year.

C) Overall, the value of imports rose by just under double over the period given.

D) Likewise, imports from China rose over the period to reach 30% in 2000.

E) At the start of the period, the US imported fish predominantly from Canada but, by the final year, other countries had become the main source.

F) Conversely, by 1992, other countries had replaced Canada as the main supplier and made up 46% of all imports in 1992 and 42% by 2000.

G) The table shows the value of fish that was imported to the US (measured in billions of dollars) in 1988, 1992 and 2000, while the three pie charts illustrate the proportion of fish that the US brought in from China, Canada and other countries in the same three years.

H) The imports from Canada then proceeded to fall to 28% in the final year.

ANSWERS & FULL MODEL ANSWER:

Click here to reveal answers and model: Answers

Answer: G C E B A H F D

See the model answer below to check how the above information is organised into paragraphs.

IELTS Model Answer: Table & 3 Pie Charts

The table shows the value of fish (in billions of dollars) that was imported to the US in 1988, 1992 and 2000, while the three pie charts illustrate the proportion of fish that the US brought in from China, Canada and other countries in the same three years.

Overall, the value of imports rose by just under double over the period given. At the start of the period, the US imported fish predominantly from Canada but, by 1992 other countries became the main source.

Regarding the table, the value of imports started at $6.57 billion in the first year, increasing to $8.52 in 1992 and reaching $10.72 in the last year.

In terms of the source of fish importation, Canada supplied the overwhelming majority in 1988 (60%) compared to China and other countries which provided only 13% and 27% respectively. The imports from Canada then proceeded to fall to 28% in the final year. Conversely, by 1992, other countries had replaced Canada as the main supplier and made up 46% of all imports in 1992 and 42% by 2000. Likewise, imports from China rose over the period to reach 30% in 2000.

Examiner Comment: Vocabulary is accurate and flexible. Paraphrase for the topic vocabulary =fish importation, provided, supplied, suppliers. Please note that the topic vocabulary provided by IELTS was also used and this is fine. Sentences are complex and accurate. The writer offers a good range of sentence structures and linking words (while, overall, regarding, in terms of, compared to, likewise, on the other hand). The overview statement is easy to find and contains the key features for both table and charts. Details are well organised into logical body paragraphs. It is fine that body paragraphs are not of equal length in report writing. This is estimated at band 9.

.

More IELTS Writing Task 1:

For more multiple tasks and other types of task 1 model answers, click below:

Note: GT candidates are not given such tasks. GT writing task 1 is a letter only. Click here: Essential Tips for IELTS GT Letter

FREE SUBSCRIBE

Subscribe to get new lessons & tips by email.

.

IELTS Table Band Score 9 Model Answers with Tips

Below is an IELTS table with model answer for Writing task 1. The tables below are typical of what you will get in your IELTS test. The model answers help you understand how to structure your table writing and organise data into paragraphs. Getting lost in too many numbers is the biggest challenge for IELTS tables. All model answers are estimated at band 9 and are written as a safe guide to learn from for all band scores.

How to Approach IELTS Table Questions

Useful strategies for IELTS Tables in Writing Task 1: Below are useful steps to ensure that you approach your IELTS table correctly. Try not to get lost in detail and instead look for patterns, similarities and differences to group information together.

  1. Analyse the key information in each category.
    • look for key features (highs/lows/usual data/ changes)
  2. Think about grouping information and categories together
    • if numbers are all below 5%, group them together as one but avoid writing them as a list and instead refer to them collectively
        • group information together with similar trends is essential for an IELTS table because of the volume of data given.
        • you get a lower score if you give too many small details
        • you get a lower score if you miss out information
    • if a number or a category is unusually high, single it out as an individual feature
  3. Plan your paragraphs and content. Each paragraph has a unique and clear function. Use the model table answers above to review them.
    1. Introduction
    2. Overview
    3. Body Paragraph 1
    4. Body Paragraph 2
    5. Body Paragraph 3 (not usual but possible at times)
  4. The introduction should be short and factual.
    1. For a free video lesson, click here: How to Write an Introduction for Writing Task 1
  5. The overview is the most important paragraph. Make sure it contains all key features for a high score.
  6. Divide your body into paragraphs.
    1. In most tables, you will have categories along the top and the side. You must decide the best way to divide categories into body paragraphs. Always choose the most logical.
    2. The time to give data in the body paragraph. Each statement must be supported with numbers from the table given. If you don’t give numbers, you’ll get a lower score for Task Achievement which counts for 25% of your marks.
    3. You don’t have to give all details. You can group details together by giving averages or ranges.
    4. Be selective. Don’t put too many details in your report.
  7. Make sure you write over 150 words but aim for less than 200.
  8. Try to avoid being repetitive with your sentence structures.
  9. Pay attention to what type of information the table gives (static figures or changes over a period of time). This will help you decide what kind of language to use.
  10. Do not try to paraphrase all words, all the time. This leads to vocabulary mistakes. Choose wisely which words to change and which to keep the same.
  11. All information and language should be accurate for a high score

IELTS Table Model Answers

IELTS Table: Question 1

As you see, this IELTS table shows  change over two time periods with four categories in total.

IELTS Table

IELTS Table Model Answer 1

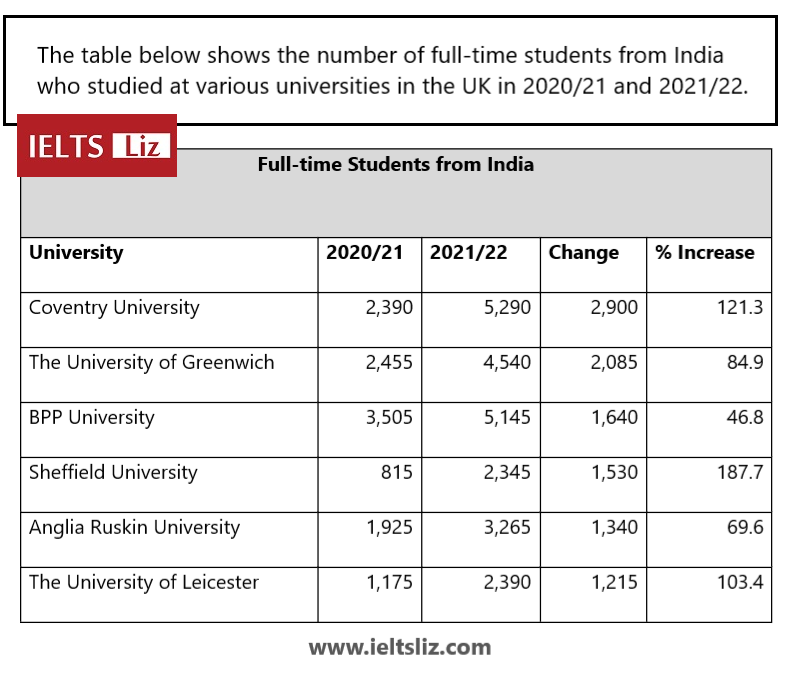
The table gives information about how many full-time students coming from India studied in six British universities in two academic years (2020/21 and 2021/22) as well as the change in numbers and percentage increase.

Overall, the greatest increase in Indian students could be seen in Sheffield University, while BBP University showed the lowest increase over the two years. The university with the most students from India was BBP University in the first year and Coventry University in the second year.

Sheffield University saw a dramatic rise of 187.7% in India students reaching 2,345 in 2021/22. Likewise, the number also climbed considerably for Coventry University by 2,900 students (121.3%) to hit 5,290 students in 2021/22. Another significant increase was seen in Leicester University from 1,175 to 2,390 students, a rise of 103.4%.

All other universities saw an increase of under 100% in the number of Indian students over from 2020/21 to 2021/22. The number of students going to University or Greenwich and Anglia Ruskin University rose by 2,085 students (84.9%) and 1,340 (69.6%) respectively. Regarding BBP University, the number of students remained high in both years at 3,505 and 5,145, which was a growth of only 46.8%.

IELTS Table: Question 2

This IELTS table is slightly easier because it contains less data. You can also see trends for each category more easily.

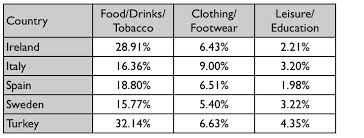
 The table below gives information about consumer spending on different items in five different countries in 2002.

IELTS Table Question Writing Task 1

(Source: IELTS Cambridge English Test Book

IELTS Table Model Answer 2

The table illustrates the proportion of consumer expenditure in Ireland, Italy, Spain, Sweden and Turkey on three types of consumer goods in 2002.

Overall, the category of consumer goods that all countries spent most on was food, drinks and tobacco, which was three times higher than on the other types of goods. The lowest spending could be seen in the category of leisure and education in all five countries. The outlay of Turkey was generally higher than the other four countries.

In terms of food, drinks and tobacco, Turkey spent the most at 32.14%. The expenditure of Ireland was also high (28.91%) compared to Sweden which spent the least (15.77%). Spain and Italy spent 18.80% and 16.36% respectively. On the other hand, the lowest expenditure was on leisure and education which accounted for under 5% in all countries. Turkey spent most on these items at just 4.35% of their national expenditure which is around double that of Spain (1.98%).

Clothing and footwear was the third category of consumer goods and outlays for those items were between 9% in Italy and 5.40% in Sweden.  The national spending in this area for the remaining countries averaged around 6.5%.

Note: in most writing task 1 reports, body paragraphs do not need to be a similar length. In report writing, it is common to very some long paragraphs and others quite short. Tables are no different to other task 1 charts.

RECOMMENDED FOR YOU IN WRITING TASK 1:

FREE SUBSCRIBE

Subscribe to get new lessons & tips by email.

.

IELTS Writing Task 1 Future Prediction Model Answer

Below is an IELTS table with dates in the future and past for writing task 1. This means you will need to use a combination of tenses to write this table task. IELTS Tables in writing task 1 can be complicated because of of all the data given to you. The model answer below shows you how to organise information and write an answer with different grammar tenses.

IELTS Table: Past & Future  Dates

IELTS Table Model Answer

Note: I’ve highlighted examples of future forms to show the options you have for presenting future predictions.

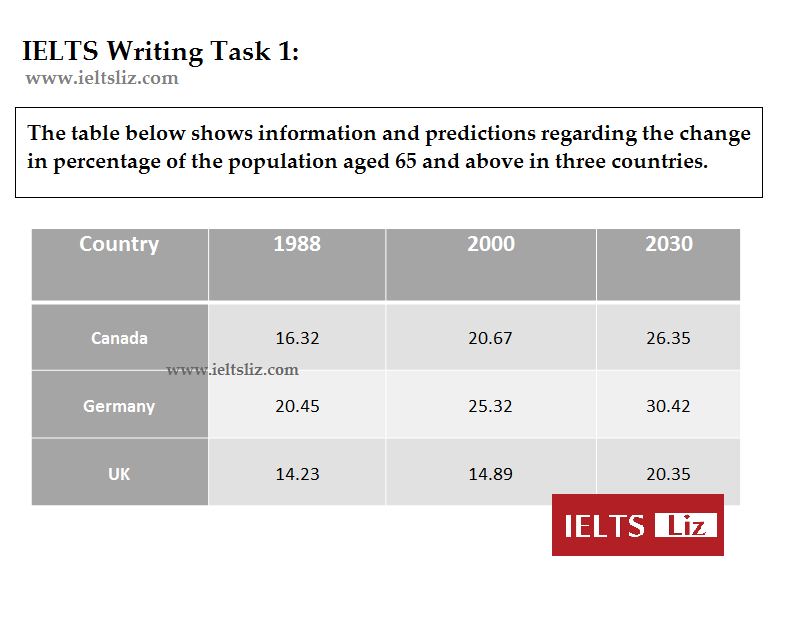
The table gives information about the proportion of the population aged 65 years and over in 3 countries (Canada, Germany and the UK) in 1988, 2000 and an estimated percentage for 2030.

Overall, the population of elderly people is predicted to rise in all three countries over the period given. The highest percentage of older people was in Germany, which is forecast to continue to remain the highest for the entire period, while the lowest proportion can be seen in the UK.

Between 1988 and 2000, the aging population of Canada and Germany went up by around 5% to 20.67% and 25.32% respectively. The UK, on the other hand, showed relatively little change in the proportion of its population who were 65 years old and above remaining at just under 15% in both years.

By 2030, it is expected that the population of people aged 65 and above will increase by approximately 5.5% in all three countries. The percentage is predicted to reach 30.42% in Germany, 26.35% in Canada and 20.35% in the UK.

(176 words)

Recommended FOR YOU:

FREE SUBSCRIBE

Subscribe to get new lessons & tips by email.

.

error: Content is protected !!