This transcript is from the video tutorial below on how to describe a bar chart for writing task 2. Learn how to organise your paragraphs and what information to highlight in your IELTS writing task 1 chart.
Click to open the transcript. Transcript
Hello let’s have a look at how to
write a report and describe an IELTS bar chart
for writing task 1 now this is the bar
chart we’re going to look at today
and you can see the description of the
chart
over here IELTS will always give you a
description
and you need to read it very carefully
because
it contains all the information you need
to know
about the chart so let’s have a look
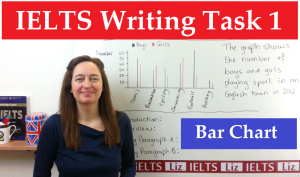
the graph shows the number of boys and
girls
and you can see here boys are in blue
and girls are in red
playing sport
now you can see that the number is on
the vertical axis here at the side
and all the sports are at the bottom
on the horizontal axis so we’ve got
6 different sports and this
is an English town in 2012
and the date shows us that this report
must be in the past tense
so always check the date
on your chart to see if you need to
write the past tense
the future tense or
if there is no date then use the present
tense
now there are four paragraphs
that you need to write for your IELTS
writing task 1
these paragraphs are very important
it is the method of organizing
the information your organization
is 25% of
your marks for IELTS writing task 1
organization and linkers
together
25% so four paragraphs
the first paragraph is the introduction
now what information
do we need there nice and simple we need
to put
this description this information
into the introduction but
can you copy no
any language that is not your language
will not contribute towards your IELTS
band score
so that means the examiner it does not
take language
that you copied from up the chart so you
need to
basically paraphrase
and that meas to write
the description again using your own
words so paraphrase the
description let me give you an
example
if we want to paraphrase the first two
words
the graph well we could change that
because we could say the
the bar chart that is more accurate
so the bar chart here we have a verb
they say shows and we can say
illustrates so the bar chart
illustrates they say the number
of boys and girls so the number we can
change that
the amount boys and girls
now be very careful boys and girls are
not
men and women men and women are adults boys
and girls are children so be careful
with your paraphrase
the best thing you can do is to say
children
divided by gender so divided by males or
females
so the bar chart illustrates
the amount of children divided
by gender playing and have they say
playing sport
now we could change that and say the number
of children the amount to children
divided
by gender who played
so now we’ve got a clause who played
and here they say sport we can say who
played
tennis badminton cycling swimming
football and hockey is it’s OK to list
six sports in the introduction yes
in fact it is, it’s a very good idea to
introduce all the sports and you could
say
who played six sports in brackets
tennis badminton cycling swimming
football
and hockey and here we can say
in an English town or in at town
in England in 2012
don’t change the date so here is
the introduction I’ve just said
so it take a little read of it and
you’ll see the information there
right so that’s the introduction all we’re
doing
is writing the same information but
using our own language
then next very important paragraph
is your overview and the overview
is a paragraph that contains
the key features of the graph
so this is all about highlighting
now is this important yes it is
if you do not have a clear overview
if you don’t have an overview
that is by a score of 5 for one of the
criteria
task achievement so no clear
overview band score 5 an overview
band score 6 a clear overview
band score 7 so you can see it that when
you have a good overview your band score
starts going up
so the key features let have a little
look at this bar chart
what key features can we see well
let’s have a look at boys first
boys are the blue and we can see here
the most popular sport for boys
was football how about for girls
we can see here the majority of girls
prefered swimming so
immediately those are key features
and highlights what else can we see
about the chart
well if you look at all the blue
and then you look at all the red
which one plays the most sport
where you can see that in this chart
boys played more sports than
girls overall
so that is something that you put in the
overview
so the overview your key features
what’s most popular for boys what was
most popular for girls
and boys played more sport
than girls now you can see there are
no numbers
there are no dates it’s just the key
features
highlighted now we come to the body
paragraph
and the body paragraph basically I’ll
put here
this is where you need to write
all the detail of this chart
and the detail must contain the numbers
so for example how many boys played tennis
how many girls played tennis
but we need to organize this information
into logical
paragraphs so let see how we can
organize it
looking at tennis boys played more tennis
than girls check badminton
and we’ll see it’s the opposite girls played more
than boys
so boys played less cycling
boys did more cycling than girls
but boys swam less than girls
boys played more football and also more
hockey
so you can see here that in four sports
boys were more active than girls
and in two of them them badminton and
swimming
girls participated more than boys
and that is how we can organized
our body paragraphs so for
body paragraph A I would have
football first
because that was the most significant
then I would have tennis
after that I would then have
cycling and then hockey
so I’ve got 4 sports that I’m going to
explain and give detail about
in paragraph A for the body
and paragraph B of course I’m gonna
have the girls
and swimming I will put first
and then I would put badminton
so but is how you organize it and
when you come to writing body
paragraph
A you should give sentence
for each sport comparing
girls and boys playing that sport
let me give you an example football
while the number of boys who played
football
was 60, (comma)
the number of girls was only 20
if we move on to tennis we can write
with regards to tennis, the number boys
playing tennis was 50
whereas about 35
girls played tennis
so all you need to do is give a nice long
sentence
comparing boys and girls for each sport
and put the data the numbers
in the sentence now why
are numbers important well let me explain
again the examiner will check for the
numbers
in the body paragraph you must have
numbers
to support your detail
in the sentences band score 5
there are no numbers
no data to support the sentence
band score 6 you have numbers
with the description in
the body paragraphs so you can see
that when you do not put your numbers
then your band score will go down
band score 5 when you put the numbers then
your band score will go up 6, 7 and 8
so that is very important for your
writing task 1
well that’s all for this lesson again if
you want some more lessons
and you want more tips just follow me
on Facebook
and if you would like to see the model
for this bar chart
to see a model band score 9 report
then please just click here and you
will see it
that’s all for this lesson I’ll see you
again in another
IELTS lesson
To watch this video on youtube, please click here.