IELTS Diagram Paragraphs and Organisation

IELTS writing task 1 diagrams must be clearly organised with logical paragraphs. This is part of the marking criteria of Coherence and Cohesion which is 25% of your marks. Most IELTS diagrams show a type of process which is divided into stages or given as a cycle. Also remember that writing task 1 is a report, not an essay.

You must organise your IELTS diagram into different paragraphs. Look at the process below and then answer the questions to learn about organising information.

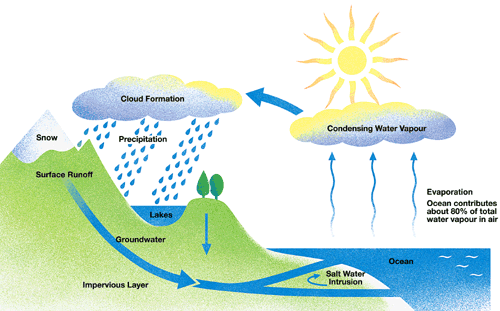
IELTS Water Cycle Diagram:

IELTS_Writing_Sample_Task_1_Water_Cycle

Source: Diagram not designed by IELTS Liz.

Questions 

Learn to analyse and organise your IELTS diagram by answering the following questions:

  1. How many paragraphs would you have in your report?
    1. Tips: Never have only one body paragraph.
  2. What information would you put in each paragraph?
    1. Tip: Use the arrows and always organise the information logically.

Answers

Read the answers very carefully and look at each point given in the diagram. Click below to reveal the answers:

Answers

1. There should be 4 paragraphs for this report.

2. You should put the following information in each paragraph:

  • Introduction: You need to introduce the content of the diagram (the process of the water cycle).
  • Overview: Put the key stages in this statement (a continual cycle of evaporation, cloud formation, rain and water returning to the sea).
  • Body paragraph A: Water in the ocean, evaporation, condensing water vapour and cloud formation.
  • Body Paragraph B: Precipitation, rain or snow, lakes, surface run off, ground water, impervious layer and salt water intrusion. You also need to note that at the water cycle starts again as the water returns to the ocean.
    • For the body paragraphs, you need to describe each stage in detail using full sentences linked together. You should divide the body into two or three paragraphs for all diagrams.

Example Introduction and Overview

The diagram illustrates the key stages in the water cycle.

Overall, the water cycle is a continual process of water evaporating and forming clouds which then return the water to the land and sea in the form of rain.

  • Note: You can see that the introduction is short and brief. You can see that the overview contains the key words as well as the key stages in summary.
  • It is possible to put these two sentences into one paragraph.

IELTS Writing Task 1

For writing task 1 model answers and more tips, see this page: IELTS Writing Task 1 Model Answers & Tips

All the best

Liz

Get my free lessons by email

Subscribe for free to get my new IELTS lessons sent to your email inbox.

Full Model Answer to Bar Chart Lesson

Creating a Model Answer for IELTS writing task 1.

Many students asked me to write a full model answer for this bar chart which was used in my lessons last week.

Below you will find 10 sentences. Put them in order to create a high band score model answers.

Source of Bar Chart: https://www.english-in-chester.co.uk

IELTS Bar Chart Model: Sentence Ordering

Put the sentences in order to make a full answer. Download Sentences: bar chart model lesson

  • A) Teenagers spent 25 hours on watching television in 2002 which increased to almost 40 hours in the final year.
  • B) The other pursuits showed a decrease in hours, except watching DVD’s which fluctuated.
  • C) Going to pubs and discos, watching TV and shopping all showed an increase in the number of hours teenagers spent on these activities.
  • D) The bar chart illustrates how many hours adolescents in Chester spent on seven activities each week between 2002 and 2007.
  • E) While teenagers occupied 10 hours doing homework in 2002, this figure dropped to just over 5 in 2007.
  • F) The number of hours teenagers dedicated to watching DVD’s was only 10 hours in first and final years, but reached a peak of over 15 hours in  2004 and 2005.
  • G) Overall, the most popular activity over the period given was watching TV, whereas bowling was the least favourite.
  • H) Bowling was under 5 hours throughout the entire period declining by about 4 hours in total.
  • I) Both going to pubs and discos, and shopping more than doubled in hours from over 5 to over 15 and from over 5 to exactly 15 respectively.
  • J) Playing sport fell more dramatically from 10 hours to around 3 hours.

Notice how many sentences are used to create a full model answer. IELTS writing task 1 does not require many sentences. There are NO fixed number of sentences for writing task 1, but you can see that you do not need many to write a high score answer.

Answers

Answers are now available. Please remember the answers also contain the full model answer in the right order. This isn’t just a lesson to complete an exercise, it is a method of helping you understand model answers and to learn from them. Take your time to review your answers and also review the full model.

Click below for the Answers

Answers

D, G, C, B, A, I, E, J, H, F

The bar chart illustrates how many hours adolescents in Chester spent on seven activities each week between 2002 and 2007.

Overall, the most popular activity over the period given was watching TV, whereas bowling was the least favourite. Going to pubs and discos, watching TV and shopping all showed an increase in the number of hours teenagers spent on these activities. The other pursuits showed a decrease in hours, except watching DVD’s which fluctuated.

Teenagers spent 25 hours on watching television in 2002 which increased to almost 40 hours in the final year. Both going to pubs and discos, and shopping more than doubled in hours from over 5 to over 15 and from over 5 to exactly 15 respectively.

While teenagers occupied 10 hours doing homework in 2002, this figure dropped to just over 5 in 2007. Playing sport fell more dramatically from 10 hours to around 3 hours. Bowling was under 5 hours throughout the entire period declining by about 4 hours in total. The number of hours teenagers dedicated to watching DVD’s was only 10 hours in first and final years, but reached a peak of over 15 hours in 2004 and 2005.

Word count = 194 (you do not need to write the word count in your test)

Paragraphing Tips

  • It is possible that the last sentence about DVD’s could be written as a separate paragraph.
  • Always have an introduction and overview. They must be separate statements.
  • Always divide your body paragraphs into two (or sometimes three) paragraphs.
  • Your body paragraphs should be logical and help to highlight similarities and differences.
  • Learn an empty line between paragraphs to make them clear and easy to see. This is not a requirements, it is a recommendation. If your paragraphs are not easy to see, your score might be lower.


All the best, Liz

……………………………….

FREE SUBSCRIBE to Get New Lessons and Tips by Email

Organising Information in Bar Chart

Do you know how to organise information in an IELTS bar chart? Bar charts are common in IELTS writing task 1 academic paper.

You must be able to organise details into body paragraphs in IELTS writing task 1. Some people find this difficult to do when there is a lot of information in the bar chart. Writing task 1 is not an essay, it is a report which needs to be concise and highly organised.

Remember that 25% of your marks for writing task 1 is about your paragraphing, organising and linking methods. Planning your paragraphs is essential.

Check your organisation skills

The bar chart below shows the hours per week that teenagers spend doing certain activities in Chester from 2002 to 2007.

Source of Bar Chart: https://www.english-in-chester.co.uk

Questions for You

  1. How many paragraphs would you have?
  2. How would you organise the categories into body paragraphs? Which categories go into which body paragraphs?

Answers

The answer to this lesson is now available.

CLICK HERE FOR ANSWERS: Answers to bar chart organisation

All the best

Liz

Get my free lessons by email

Subscribe for free to get my new IELTS lessons sent to your email inbox.


Is the Overview Important in IELTS WT1? Answers

IELTS Writing Task 1 Overview (Academic Paper): Tips, Videos and Answers

Do all types of writing task 1 have an overview?

Yes. ALL TYPES of writing task 1 for the academic paper should have an overview. The types are listed below.

  1. bar chart
  2. pie chart
  3. table
  4. line graph
  5. map
  6. diagram (process)

All the above types MUST have an overview.

What is an Overview?

  • An overview is a statement or statements which contain all the key features in the task given to you.
  • It is important that the key features are collected in one overview and not put in different places.
  • An overview will contain all features – this means if you have two charts, there is only one overview which contains the key features for both tasks.
  • You are marked on your ability to choose the key features. Each task will be different.

Is the Overview Important?

Yes. It is the most important paragraph in your writing task 1 for the academic paper.

The overview is marked in the marking criterion of Task Achievement. This criterion counts for 25% of your writing task 1 marks. The examiner will look specifically for an overview in all types of writing task 1 (academic). See below:

Band 5 = no clear overview

Band 6 = presents an overview

Band 7 = presents a clear overview

You can see that your score will go up or down depending on your overview. If you miss the overview, you will get Band 5 or below in Task Achievement. If you are aiming for band 7, 8 or 9, you must have a clear overview with key features well selected and highlighted.

Learn more about the band score requirements of IELTS writing task 1 on this page: Band Score Tips & Info Writing Task 1

Overview or Conclusion?

See this video about the difference between an overview and a conclusion.

[su_youtube url=”https://youtu.be/zjzuxyVlkR8″]

Paragraphing: Where to put the overview?

See this video lesson to learn about the paragraphs for writing task 1, including where the overview should be put.

[su_youtube url=”https://youtu.be/TzLyARGcTEA”]

Model Writing Task 1 Answers

See this page to take a look at model answers for all types of IELTS writing task 1. You will see the overviews for ALL types of writing task 1. Model Answers and Tips: IELTS Writing Task 1

Hope this was useful 🙂

All the best

Liz

IELTS Complaint Letter: Model

Below is a model IELTS complaint letter which is estimated at band score 9. People taking the GT writing paper will be expected to write a letter for their writing task 1. That letter should be over 150 words. Complaint letters are one of the most common types of letters that you can be expected to write.

You bought a TV a week ago but when you got home you discovered it did not work properly. You called customer service to report the problem but you have not yet received any help.

Write a letter to the company and in your letter:

  • introduce yourself
  • explain the problem
  • and state what action you would like from the company

Model IELTS Complaint Letter

The letter below will show you how to organise information into paragraphs and extent information to create a high band score IELTS complaint letter. Note that this is a long letter. People who are below band 9 should not aim for this. It is usually better to aim between 170 and 190 words. Long letters also don’t increase your score. However, I wanted to show you examples of how ideas can be expanded and for this reason, this sample letter is longer than normal.

Dear Sir or Madam,

I am writing this letter to report the faulty TV that I purchased from your company on Tuesday last week.

My name is John Davidson and I am one of your frequent customers. I live in Woodstock and have been using your services and buying your products for the last 11 years.

On Tuesday, 12th June, I visited your store to purchase a TV. I bought a Toshiba LED TV which has the code 40L675B40. On purchasing this TV, I was assured that this was the latest model and the best there was to buy. However, when I got home I discovered that not only did the remote controls not work but also the quality of the picture was not as good as promised, in fact it was quite blurry. I called your customer service department immediately on Tuesday and they assured me that my TV would be replaced or fixed within two days. I am disappointed to say that this has not happened and I have received no communication since then.

I am exceedingly displeased with both the quality of the product I purchased from your company as well as the poor  service I have received since. I hope this problem will be resolved promptly. I expect to receive a replacement TV or have my current TV repaired but only if it could be fixed within a day.

I look forward to hearing back from you immediately.

Yours faithfully,

Mr J H Davidson

Recommended for GT IELTS Writing Task 1

Click below:

Essential Tips for IELTS GT Letters: Writing Task 2

Practice IELTS Letters to practice at home

——————-

Subscribe to get New Posts by Email

IELTS Diagram: Model Answer Band Score 9

This IELTS diagram model answer is estimated at band score 9. It is possible to have a diagram in your IELTS writing task 1 academic paper. A diagram is also known as a process. The diagram shown below is from IELTS Cambridge Book 8, Test 3.

The diagram below shows the stages and equipment used in the cement-making process, and how cement is used to produce concrete for building purposes.

cement and concrete

  • Source: IELTS Cambridge English Test Book 8

Diagram Model Answer

The diagrams illustrate the way in which cement is made and how it is then used in the process of making concrete.

Overall, limestone and clay pass through four stages before being bagged ready for use as cement which then accounts for 15% of the four materials used to produce concrete. While the process of making cement uses a number of tools, the production of concrete requires only a concrete mixer.

In the first stage of making cement, limestone and clay are crushed together to form a powder. This powder is then combined in a mixer before passing into a rotating heater which has constant heat applied at one end of the tube. The resulting mixture is ground in order to produce cement. The final product is afterwards put into bags ready to be used.

Regarding the second diagram, concrete consists of mainly gravel, which is small stones, and this makes up 50% of the ingredients. The other materials used are sand (25%), cement (15%) and water (10%). These are all poured into a concrete mixer which continually rotates to combine the materials and ultimately produces concrete.

Comments: This diagram gives a concise introduction. The overview contains key features of both diagrams and also highlights the connection between them. The body paragraphs are organised well and linking devices are used flexibly and accurately. Each body paragraphs explained the steps of each process in a logical order. Complex sentences are accurate and there is also passive voice used. Collocations are well used.

Recommended

Get my free lessons by email

Subscribe for free to get my new IELTS lessons sent to your email inbox.

How to Describe Pie Charts in IELTS Writing Task 1

Learn in easy steps how to describe IELTS Pie Charts for writing task 1. Below are easy techniques to help you write each paragraph: introduction, overview, body paragraph 1 and body paragraph 2.

Pie Chart

IELTS pie chart lesson

Source: The above pie charts were not created by IELTS Liz.

Describing Pie Charts Step by Step

Below you will find easy to follow advice on how to describe your IELTS pie chart paragraph by paragraph.

Introduction

You must paraphrase the information given at the top of the charts “The graph shows the main sources of energy for the USA in 1980 and 1990”. You cannot copy this, you must use your own language.

Tips

  • the graph = the pie chart
  • shows = illustrates
  • main sources of energy = energy production from different sources
  • for the USA = don’t change this
  • in 1980 and 1990 = in two different years (1980 and 1990)

Try writing your introduction before checking the model answer. To see model introduction, click here: Model Answer

The pie charts illustrate the changes in energy production from five different sources (oil, natural gas, coal, hydroelectric power and nuclear power) for the USA in two different years (1980 and 1990).

Overview

The overview contains the key features of the charts. Answer the questions below to find the key features.

  1. What was the main source of energy in 1980?
  2. What was the main source of energy in 1990?
  3. Which produced the least energy in 1980?
  4. Which produced the least energy in 1990?
  5. Did the amount of energy produced by each source change a lot or just a little between the years?
  6. Did all types of energy increase by 1990?

Now write your overview before you check the model. To see model overview, click here: Model Answer

Overall, oil  constituted the main source of energy production in both years, while hydroelectric power  produced the least energy. There was a slight decrease in production from oil and natural gas, whereas an increase can be seen in the figures for coal and nuclear power.

Body Paragraph 1

This paragraph will give details about oil and hydroelectric power, which we highlighted in the overview above.

Tips

  • You will need to write one sentence about oil comparing the percentage each year and then one sentence about hydroelectric power comparing the years.
  • You must add data (percentages and dates) to support each sentence

Here are two example sentences. Fill in the gaps with the right words.

The amount of energy produced by oil in the USA 1. ………………. 42% in 1980 and this, then, 2. ………………….. to a third (33%) in 1990. The proportion of energy from hydroelectric power, 3………………, remained constant in both years ………a mere 5%.

For answers, click here: Answers

  1. accounted for / comprised of / made up / was
  2. fell / declined / dropped / went down / decreased
  3. on the other hand / by contrast / in contrast ( we use a linker to highlight that this is opposing information to the previous sentence)
  4. at

Body Paragraph 2

This paragraph will give detail about the other sources of energy in the pie charts.

Tips

  • which sources increased?
  • which sources decreased?
  • what were the percentages for each source?

Again, fill in the gaps in these model sentences.

The energy generated by natural gas, which was the second 1. …………… source of energy in the USA in 1980, fell 2. ………. 1% to a quarter of all energy produced in 1990. In contrast, production by coal 3. ……………… from 22% to 27% in 1990 4. …………….. there was a 5% rise in energy from nuclear power to reach 10% in the second year.

For answers, click here: Answers

  1.  largest / major
  2. by (this is used when writing about differences in amounts)
  3. increased / rose / went up / climbed / grew
  4. while / whereas

Recommended Lessons

IELTS PIE Chart Model
Practice Writing Task 1 Charts

……………………….

Free Subscribe to get new Posts by Email


Improving IELTS Writing Task 1 Introduction

This lesson focuses on improving your IELTS writing task 1 introduction for the academic paper. To write an introduction you must paraphrase and re-write the information given by IELTS about the chart of graph.

Below is a sample line graph sent to me by an IELTS Candidate.

The line graph below shows the number of overseas students who came from six Asian countries to study in Australia from 1994 to 1997.

overseas students line graph ielts

Source: Graph above was not created by IELTS Liz.

Introduction Paragraphs for Writing Task 1

Below are two introductions written by the IELTS candidate. Would you use one of these introductions or would you write a different introduction?

Introduction 1: The diagram shows the amount of students from six different countries in Asia, who came to study in Australia between 1994 and 1997.

Introduction 2: Between 1994 and 1997 the number of Asian students from six different countries, who came to study in Australia.

Questions:

  1. Do they cover all the necessary information?
  2. Are there any errors in them?
  3. How you would write your introduction to the line graph above?
  4. How many paragraphs would you have for your complete report for the above line graph?

Feel free to post your answers. However, please note I do not common on writing.

Answers and Model Introduction  

Complete the questions above. Then click below to reveal the answers and model introduction paragraph. 

Answers & Model Introduction
  1. They both cover most of the important information. However, they are lacking the list of countries. Where possible include the list, unless it is too long. 
  2. Errors:
    1. A line graph is a line graph. Those words should not be paraphrased.
    2. Always try to paraphrase the verb “shows”.
    3. The word “amount” is for uncountable nouns, not for countable nouns. We can use this word with “people” or “students”. See this page: Uncountable Nouns
  3. See the model answer below:
    1. The line graph illustrates how many students from six different countries in Asia (Japan, Singapore, Hong Kong, Malaysia, Indonesia and Korea) went to Australia to study over a period of four years between 1994 and 1997.
  4. How would you organise your task 1 writing for the above line graph? How many paragraphs would you have? What information would you put in the body paragraphs?
    1. You should have 4 paragraphs: introduction, overview, body paragraph A and body paragraph B.

      In body paragraph A, you can put information about Singapore, Malaysia, Indonesia and Korea. In body paragraph B, you can put information about Japan and Hong Kong because they showed different trends from the others.

.

IELTS Writing Task 1 Free Lessons & Tips

Click below to open all my free lessons and tips for task 1:

IELTS Writing Task 1 Free Lessons

………………..

Subscribe for Free to get New Posts by Email

error: Content is protected !!